2.Select the Disk Usage tab.
3.Using the filters at the top of the screen, select from the
a.Group and Device
b.Type (based on device type):
•Gen2 will display library, NAS share, and device
•Gen3
•Gen3 single node will display library, NAS share, CatalystStore, and device
c.The specific couplet, service set, or device (based on the selection in the Type
d.For Last (time period)
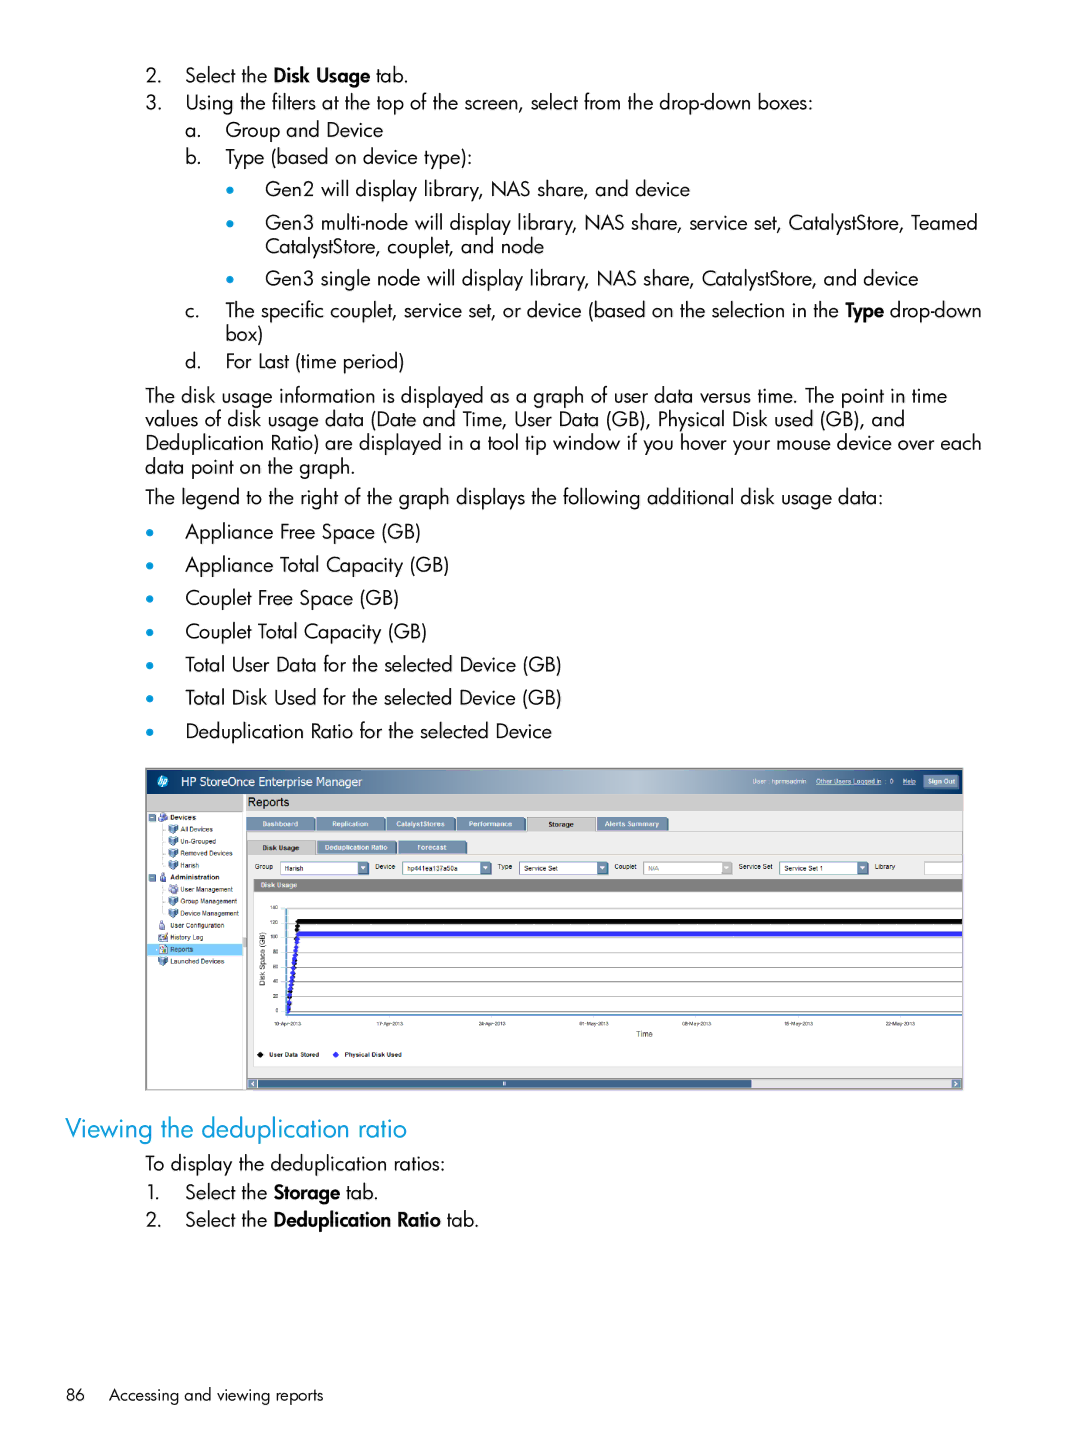
The disk usage information is displayed as a graph of user data versus time. The point in time values of disk usage data (Date and Time, User Data (GB), Physical Disk used (GB), and Deduplication Ratio) are displayed in a tool tip window if you hover your mouse device over each data point on the graph.
The legend to the right of the graph displays the following additional disk usage data:
•Appliance Free Space (GB)
•Appliance Total Capacity (GB)
•Couplet Free Space (GB)
•Couplet Total Capacity (GB)
•Total User Data for the selected Device (GB)
•Total Disk Used for the selected Device (GB)
•Deduplication Ratio for the selected Device
Viewing the deduplication ratio
To display the deduplication ratios:
1.Select the Storage tab.
2.Select the Deduplication Ratio tab.