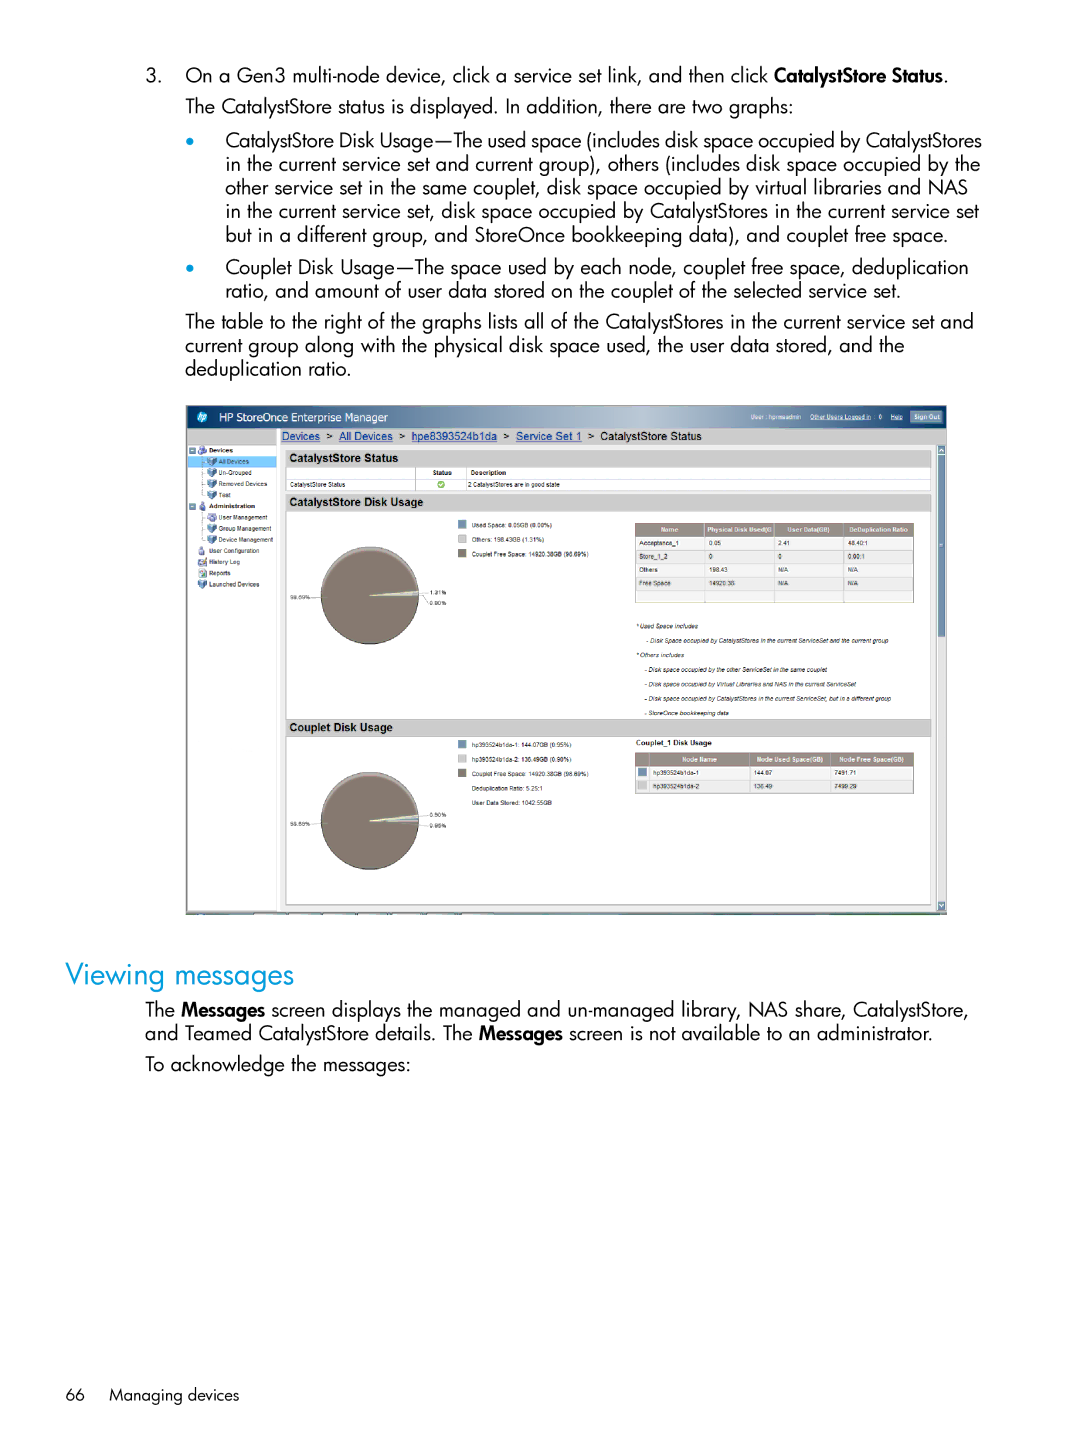
3.On a Gen3 multi-node device, click a service set link, and then click CatalystStore Status. The CatalystStore status is displayed. In addition, there are two graphs:
•CatalystStore Disk Usage—The used space (includes disk space occupied by CatalystStores in the current service set and current group), others (includes disk space occupied by the other service set in the same couplet, disk space occupied by virtual libraries and NAS in the current service set, disk space occupied by CatalystStores in the current service set but in a different group, and StoreOnce bookkeeping data), and couplet free space.
•Couplet Disk Usage—The space used by each node, couplet free space, deduplication ratio, and amount of user data stored on the couplet of the selected service set.
The table to the right of the graphs lists all of the CatalystStores in the current service set and current group along with the physical disk space used, the user data stored, and the deduplication ratio.
Viewing messages
The Messages screen displays the managed and un-managed library, NAS share, CatalystStore, and Teamed CatalystStore details. The Messages screen is not available to an administrator.
To acknowledge the messages:
66 Managing devices