Forecasting. Duration forecasting forecasts replication duration. Size forecasting predicts the data size (in GB) that can be replicated within the user provided time period (Replication window).
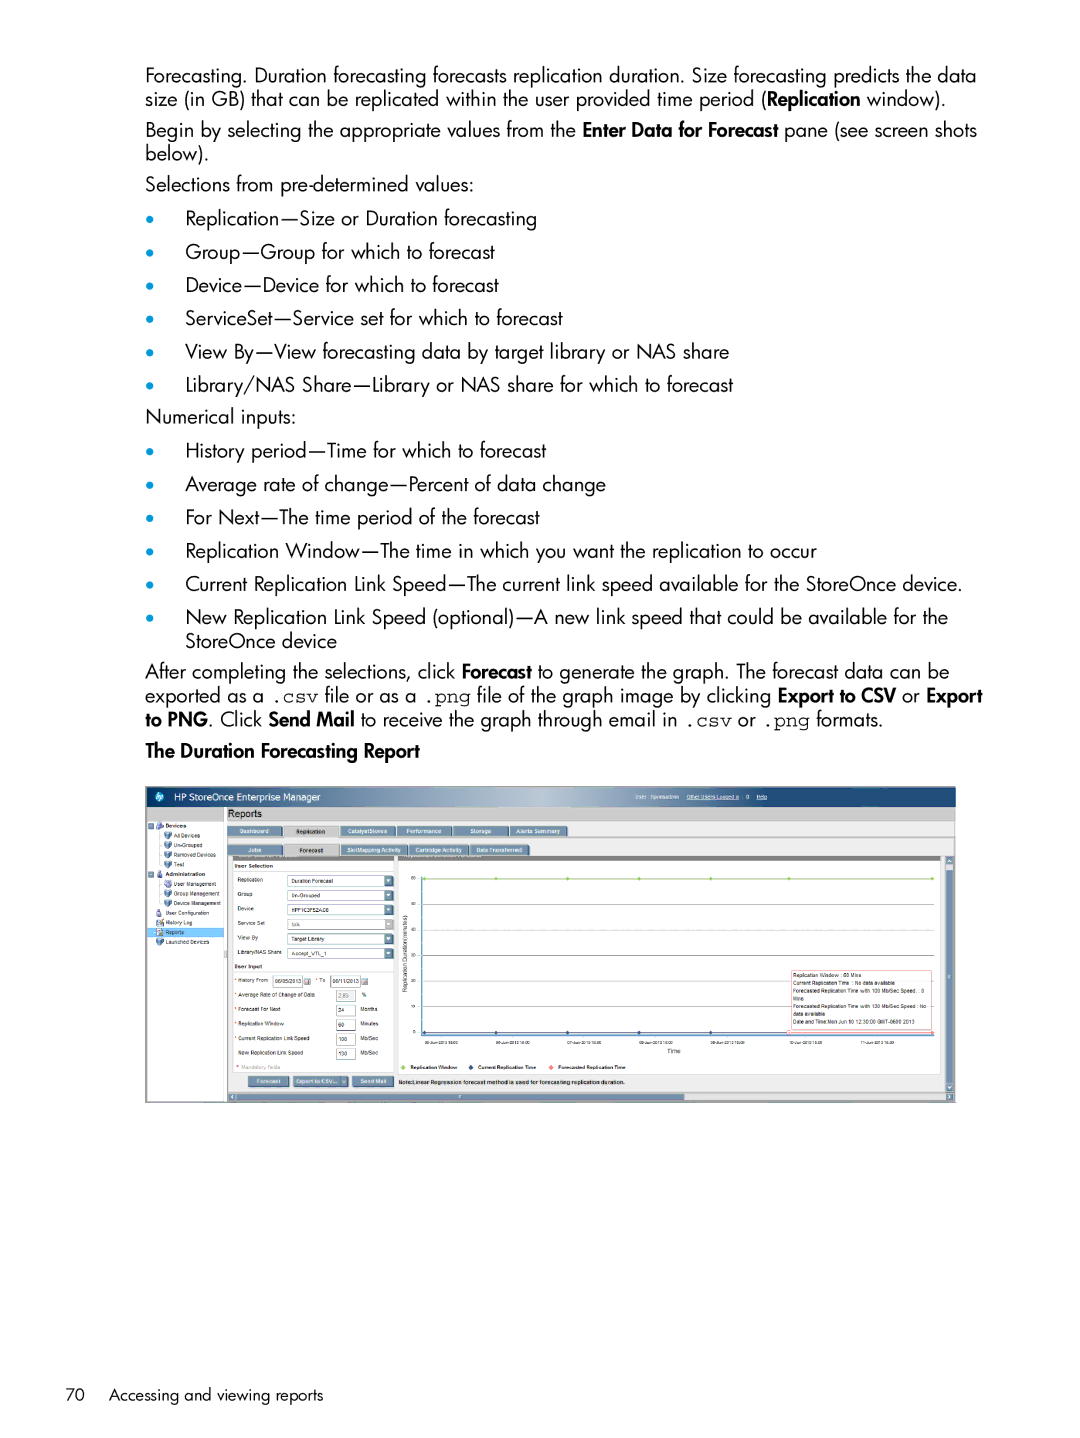
Begin by selecting the appropriate values from the Enter Data for Forecast pane (see screen shots below).
Selections from
•
•
•
•
•View
•Library/NAS
•History
•Average rate of
•For
•Replication
•Current Replication Link
•New Replication Link Speed
After completing the selections, click Forecast to generate the graph. The forecast data can be exported as a .csv file or as a .png file of the graph image by clicking Export to CSV or Export to PNG. Click Send Mail to receive the graph through email in .csv or .png formats.
The Duration Forecasting Report
