NAS SharesCatalystStoreTeamed CatalystStoreSetting the time period to display

In the View drop-down box, select Hourly, Daily, Weekly, Monthly, Yearly, or Select Range. The Period drop-down box changes based on the view selection; select the appropriate time period.

If you chose Select Range in the View drop-down box, use the From and To boxes to set the date range. You can also check the Window box to select the hour range; the data is displayed only for those hours in the date range. For example, if you select the date range from 04/01/2013 to 04/05/2013 and select the window as 14 to 16, the graph displays data only for two hours, hour 14 to hour 16, for each day in the range. If you do not select a window, the graph displays data for the full 24 hours for each days.

NOTE: The data is displayed in the following ways:The data displays at the hour level for time periods greater than two months.The data displays at the minute level for time periods less than two months.

The date is refreshed automatically with live data for a time period of last 1 hour.

Viewing the Service Set Performance report

1.Select Reports in the Navigation tree.

2.Select the Performance tab.3.Use the drop-down boxes to select the appropriate group and device.4.Use the Report At drop-down box to select the service set level.
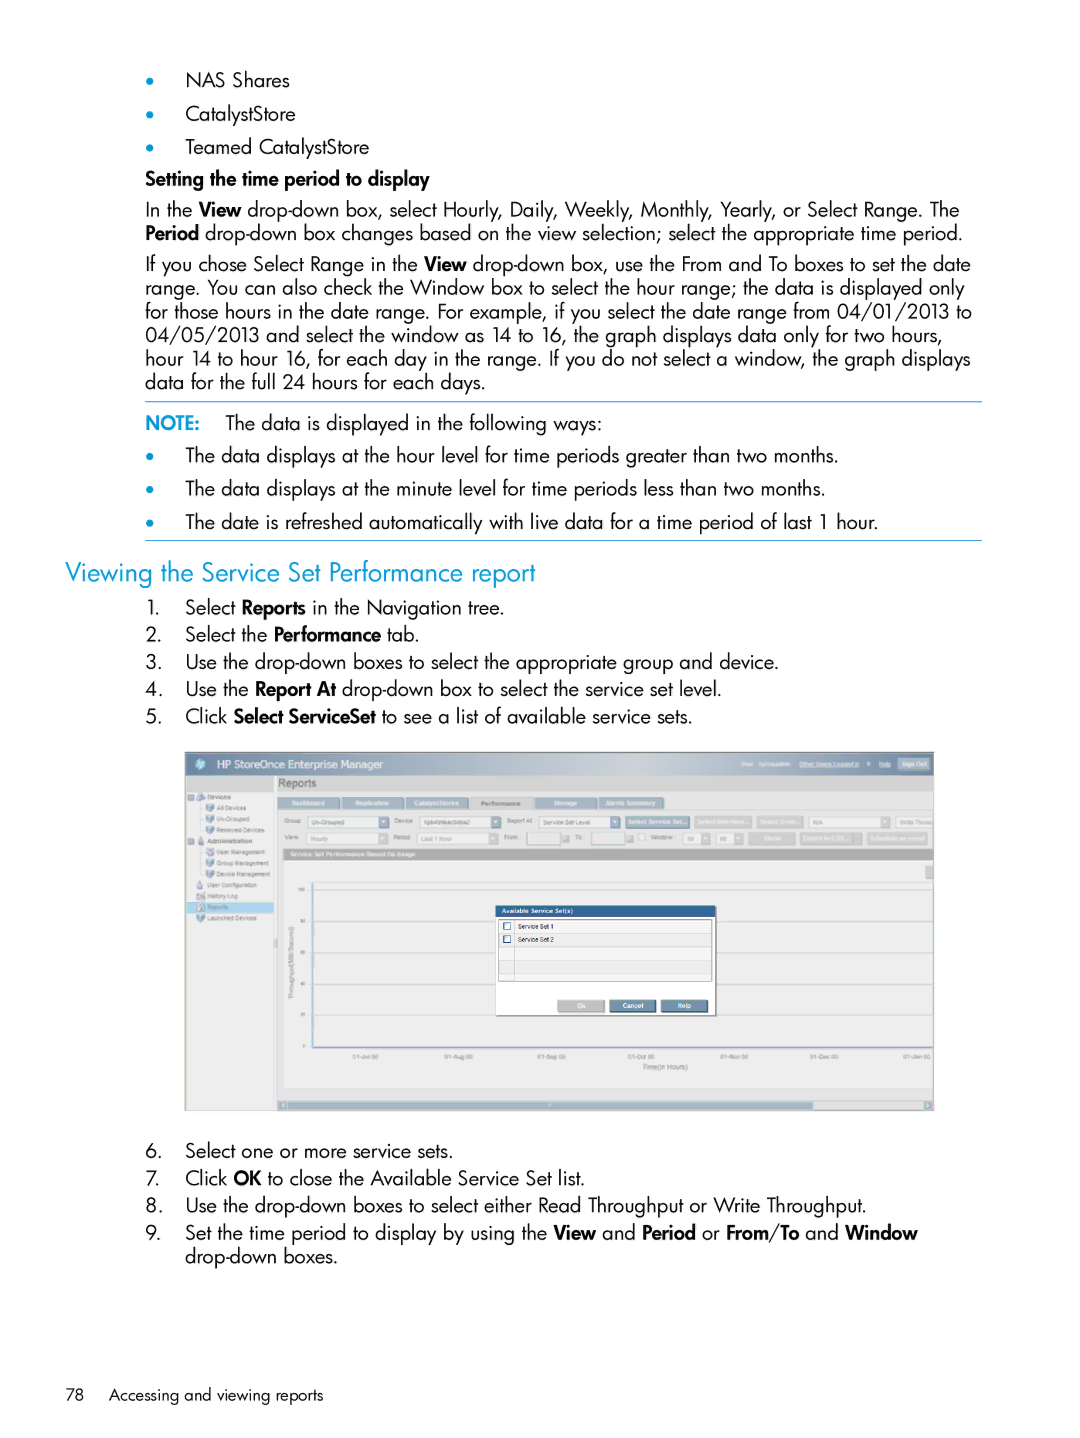
5.Click Select ServiceSet to see a list of available service sets.6.Select one or more service sets.7.Click OK to close the Available Service Set list.8.Use the drop-down boxes to select either Read Throughput or Write Throughput.

9.Set the time period to display by using the View and Period or From/To and Window drop-down boxes.

78 Accessing and viewing reports