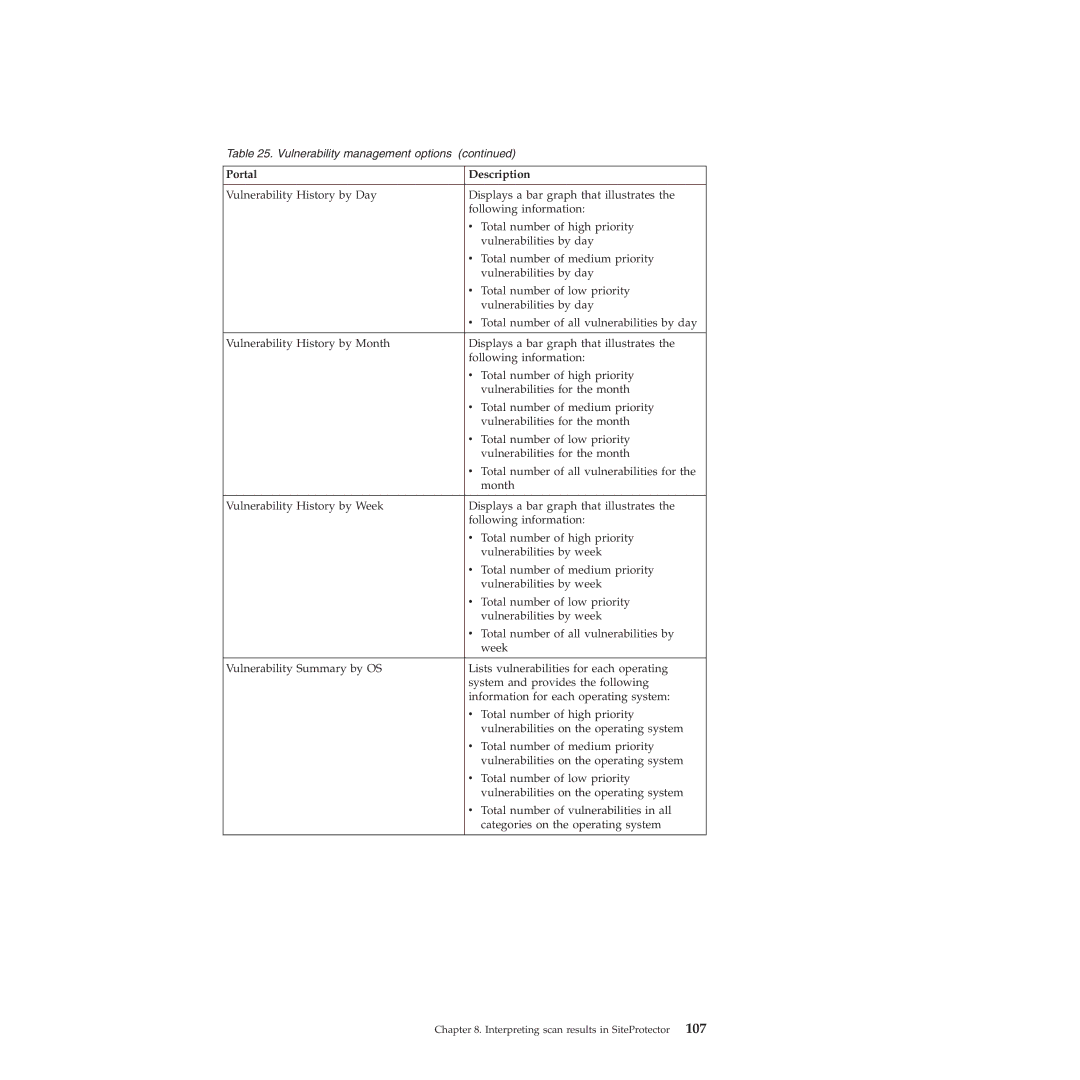
Table 25. Vulnerability management options (continued)
Portal | Description |
|
|
Vulnerability History by Day | Displays a bar graph that illustrates the |
| following information: |
| v Total number of high priority |
| vulnerabilities by day |
| v Total number of medium priority |
| vulnerabilities by day |
| v Total number of low priority |
| vulnerabilities by day |
| v Total number of all vulnerabilities by day |
Vulnerability History by Month | Displays a bar graph that illustrates the |
| following information: |
| v Total number of high priority |
| vulnerabilities for the month |
| v Total number of medium priority |
| vulnerabilities for the month |
| v Total number of low priority |
| vulnerabilities for the month |
| v Total number of all vulnerabilities for the |
| month |
|
|
Vulnerability History by Week | Displays a bar graph that illustrates the |
| following information: |
| v Total number of high priority |
| vulnerabilities by week |
| v Total number of medium priority |
| vulnerabilities by week |
| v Total number of low priority |
| vulnerabilities by week |
| v Total number of all vulnerabilities by |
| week |
|
|
Vulnerability Summary by OS | Lists vulnerabilities for each operating |
| system and provides the following |
| information for each operating system: |
| v Total number of high priority |
| vulnerabilities on the operating system |
| v Total number of medium priority |
| vulnerabilities on the operating system |
| v Total number of low priority |
| vulnerabilities on the operating system |
| v Total number of vulnerabilities in all |
| categories on the operating system |
|
|
Chapter 8. Interpreting scan results in SiteProtector 107