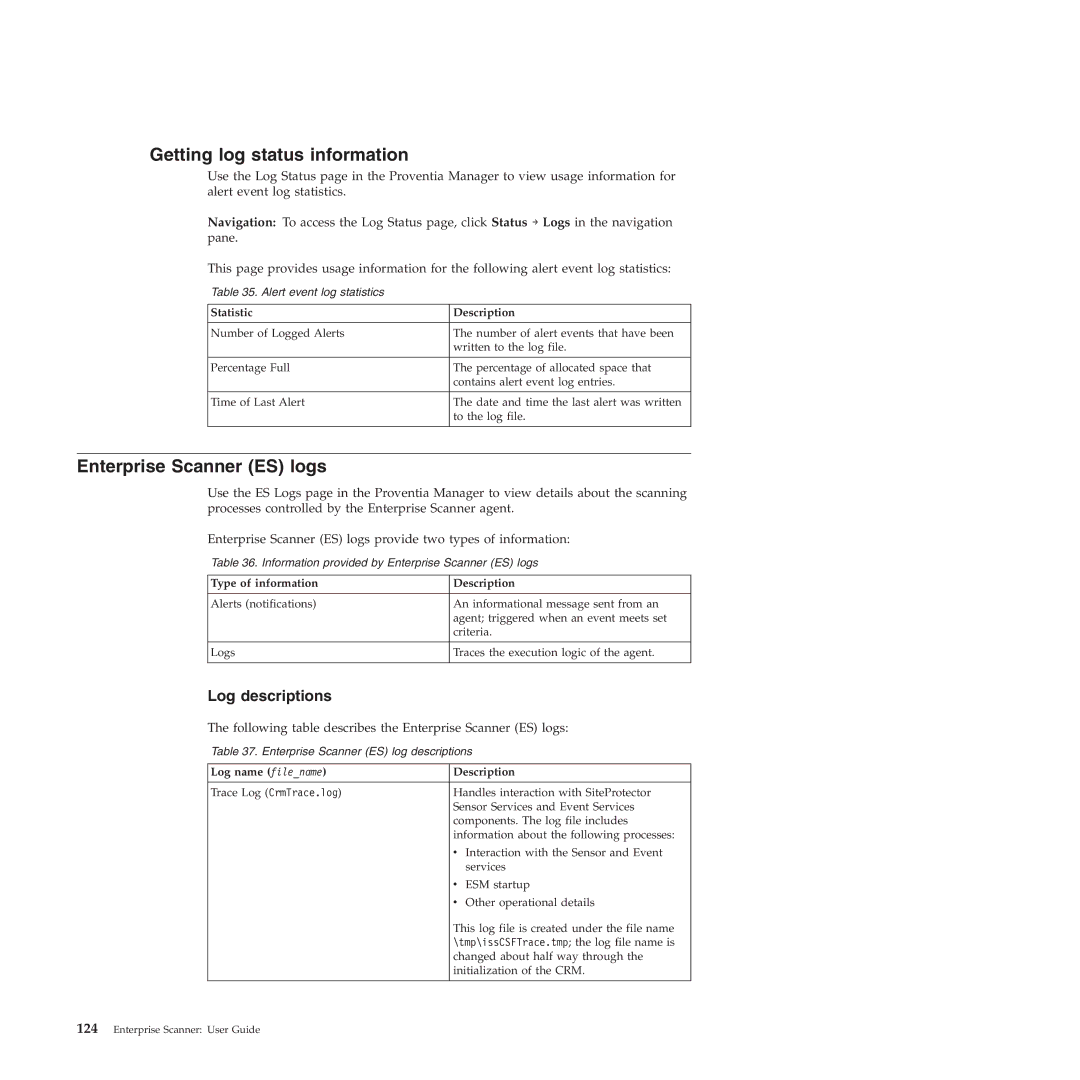
Getting log status information
Use the Log Status page in the Proventia Manager to view usage information for alert event log statistics.
Navigation: To access the Log Status page, click Status → Logs in the navigation pane.
This page provides usage information for the following alert event log statistics:
Table 35. Alert event log statistics
Statistic | Description |
|
|
Number of Logged Alerts | The number of alert events that have been |
| written to the log file. |
|
|
Percentage Full | The percentage of allocated space that |
| contains alert event log entries. |
|
|
Time of Last Alert | The date and time the last alert was written |
| to the log file. |
|
|
Enterprise Scanner (ES) logs
Use the ES Logs page in the Proventia Manager to view details about the scanning processes controlled by the Enterprise Scanner agent.
Enterprise Scanner (ES) logs provide two types of information:
Table 36. Information provided by Enterprise Scanner (ES) logs
Type of information | Description |
|
|
Alerts (notifications) | An informational message sent from an |
| agent; triggered when an event meets set |
| criteria. |
|
|
Logs | Traces the execution logic of the agent. |
|
|
Log descriptions
The following table describes the Enterprise Scanner (ES) logs:
Table 37. Enterprise Scanner (ES) log descriptions
Log name (file_name) | Description | |
|
| |
Trace Log (CrmTrace.log) | Handles interaction with SiteProtector | |
| Sensor Services and Event Services | |
| components. The log file includes | |
| information about the following processes: | |
| v Interaction with the Sensor and Event | |
|
| services |
| v | ESM startup |
| v | Other operational details |
| This log file is created under the file name | |
| \tmp\issCSFTrace.tmp; the log file name is | |
| changed about half way through the | |
| initialization of the CRM. | |
|
|
|
