4: Configuration Using Web Manager
Diagnostics Configuration
The XPort AR has several tools for diagnostics and statistics. Select the Diagnostics link on the left menu bar to display the Diagnostics menu. The sub- menus allow for the configuration or viewing of MIB2 statistics, IP socket information, ping, traceroute, DNS lookup, memory, buffer pools, processes, and hardware.
MIB2 Statistics
To view XPort AR’s MIB2 statistics:
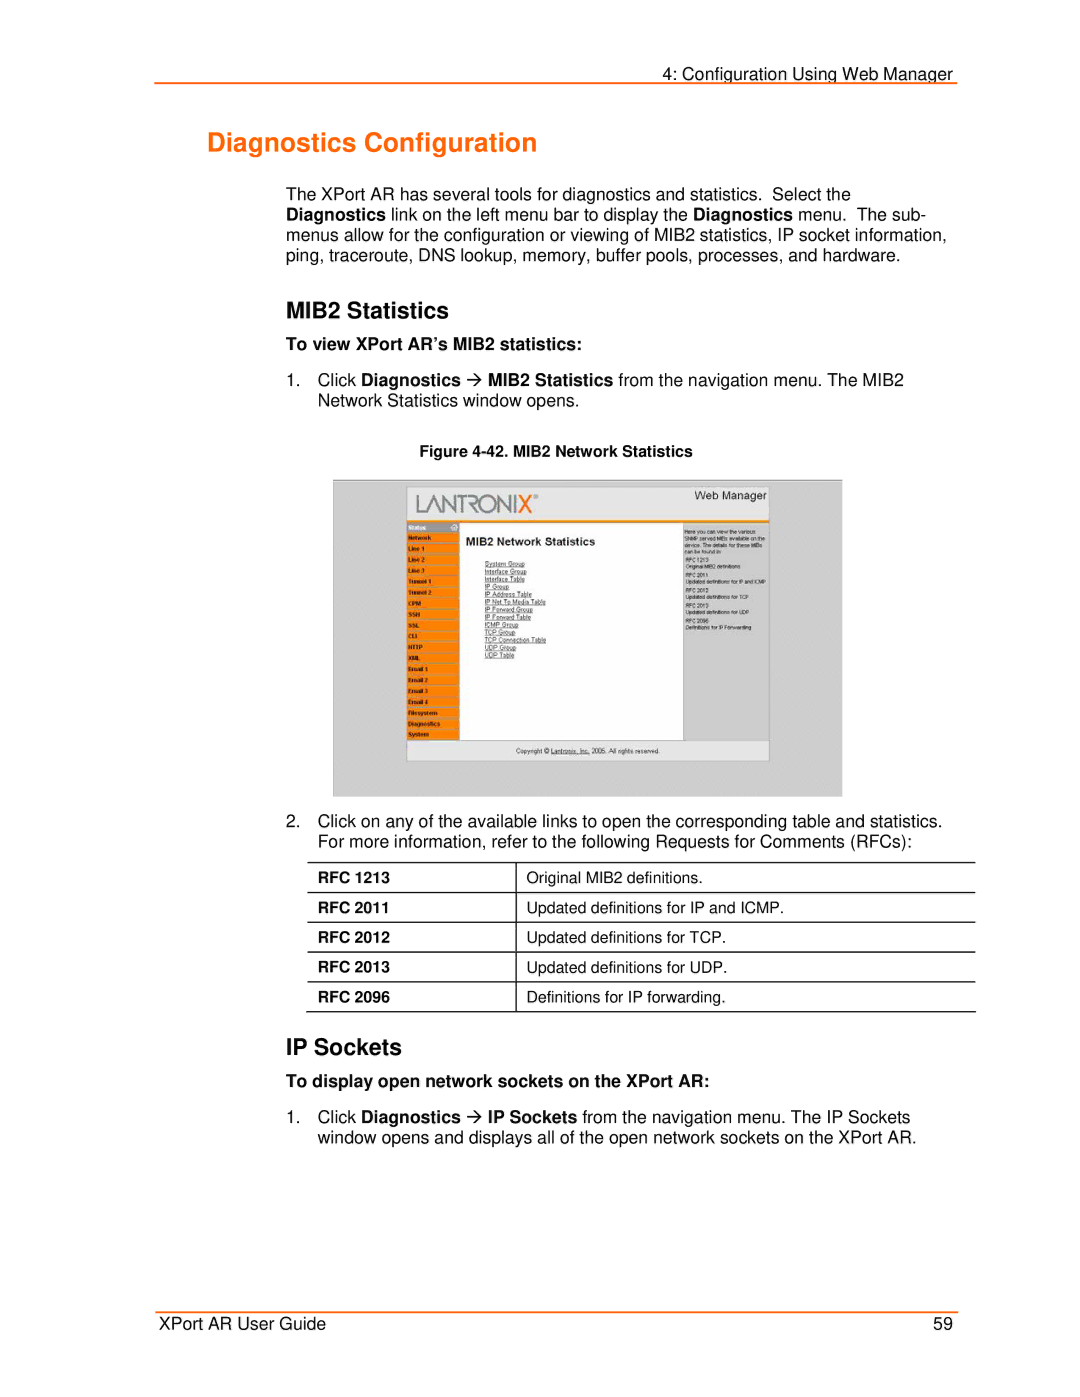
1.Click Diagnostics Æ MIB2 Statistics from the navigation menu. The MIB2 Network Statistics window opens.
Figure 4-42. MIB2 Network Statistics
2.Click on any of the available links to open the corresponding table and statistics. For more information, refer to the following Requests for Comments (RFCs):
RFC 1213 | Original MIB2 definitions. |
|
|
RFC 2011 | Updated definitions for IP and ICMP. |
|
|
RFC 2012 | Updated definitions for TCP. |
|
|
RFC 2013 | Updated definitions for UDP. |
|
|
RFC 2096 | Definitions for IP forwarding. |
|
|
IP Sockets
To display open network sockets on the XPort AR:
1.Click Diagnostics Æ IP Sockets from the navigation menu. The IP Sockets window opens and displays all of the open network sockets on the XPort AR.
XPort AR User Guide | 59 |
