4: Configuration Using Web Manager
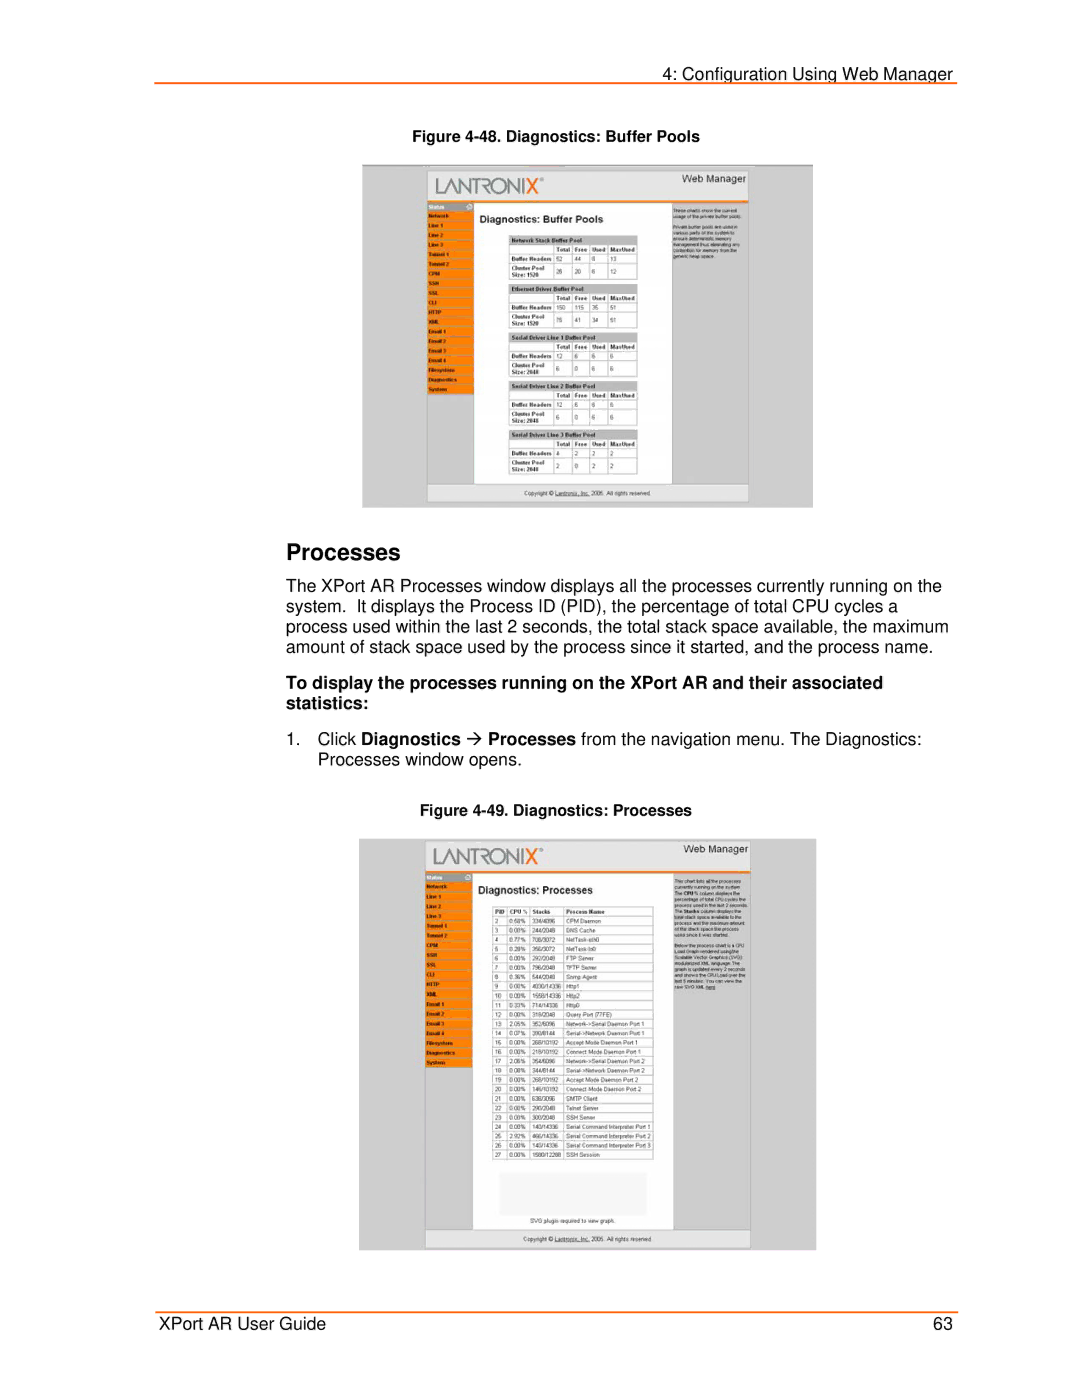
Figure 4-48. Diagnostics: Buffer Pools
Processes
The XPort AR Processes window displays all the processes currently running on the system. It displays the Process ID (PID), the percentage of total CPU cycles a process used within the last 2 seconds, the total stack space available, the maximum amount of stack space used by the process since it started, and the process name.
To display the processes running on the XPort AR and their associated statistics:
1.Click Diagnostics Æ Processes from the navigation menu. The Diagnostics: Processes window opens.
Figure 4-49. Diagnostics: Processes
XPort AR User Guide | 63 |