56 | Chapter |
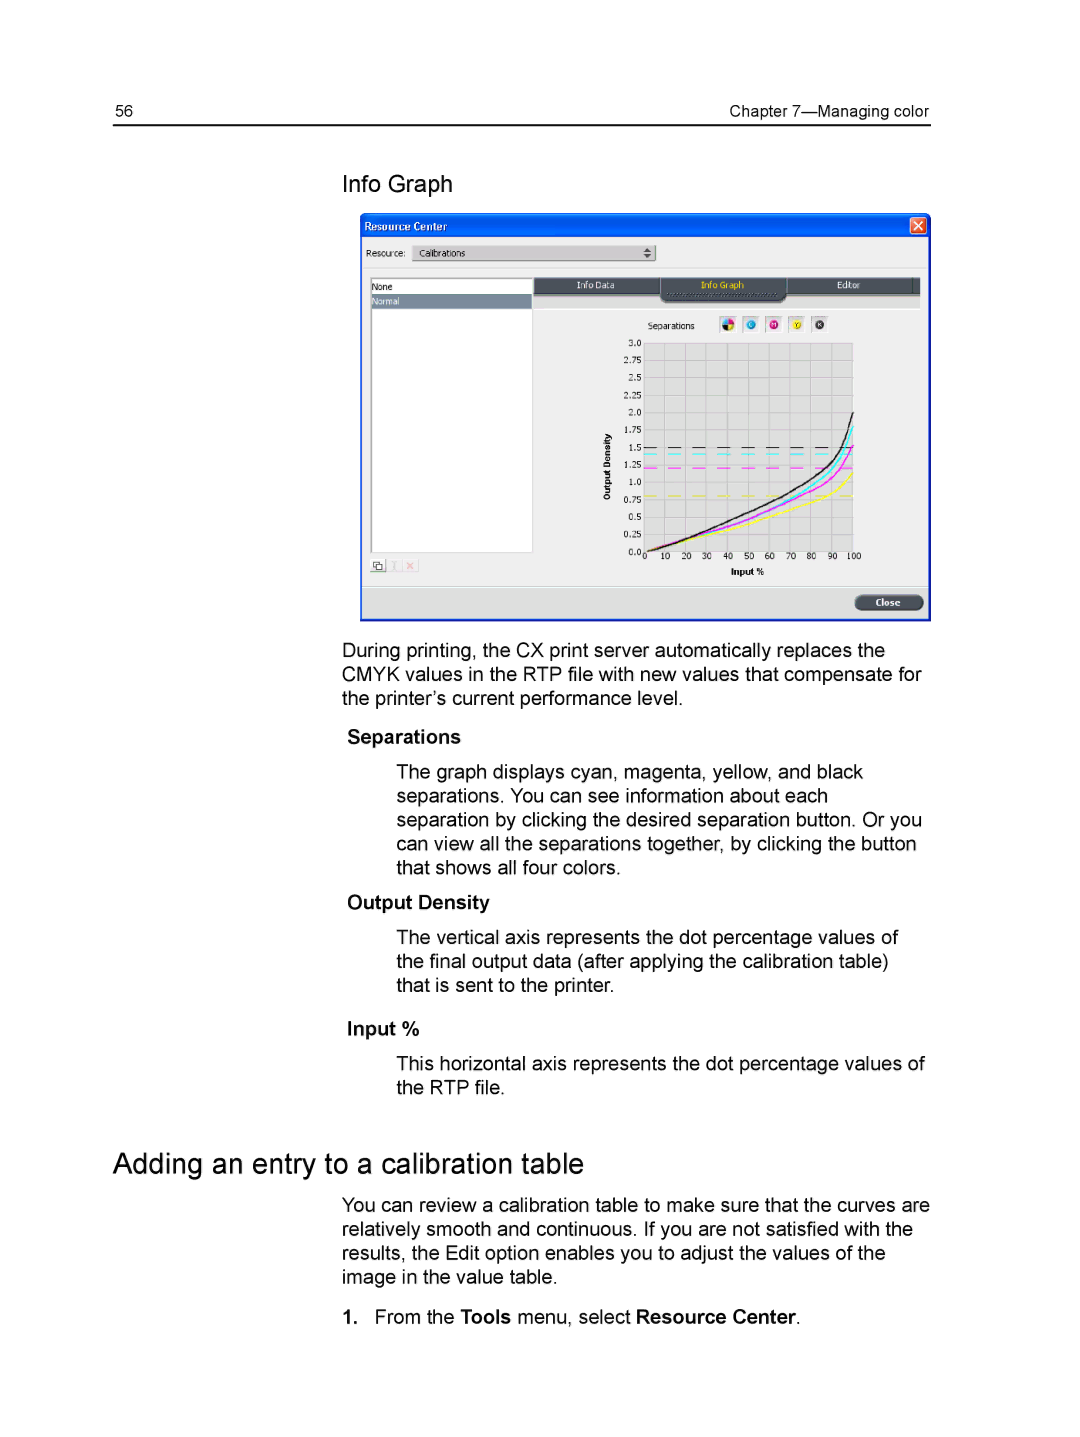
Info Graph
During printing, the CX print server automatically replaces the CMYK values in the RTP file with new values that compensate for the printer’s current performance level.
Separations
The graph displays cyan, magenta, yellow, and black separations. You can see information about each separation by clicking the desired separation button. Or you can view all the separations together, by clicking the button that shows all four colors.
Output Density
The vertical axis represents the dot percentage values of the final output data (after applying the calibration table) that is sent to the printer.
Input %
This horizontal axis represents the dot percentage values of the RTP file.
Adding an entry to a calibration table
You can review a calibration table to make sure that the curves are relatively smooth and continuous. If you are not satisfied with the results, the Edit option enables you to adjust the values of the image in the value table.
1.From the Tools menu, select Resource Center.