Chapter 3 Introducing the Web Configurator
The following table describes the labels in this screen.
Table 6 Summary: Packet Statistics
LABEL | DESCRIPTION |
Port | This is the |
|
|
Status | For the LAN ports, this displays the port speed and duplex setting or |
| Down when the line is disconnected. |
| For the WAN port, it displays the port speed and duplex setting if |
| you’re using Ethernet encapsulation and Idle (line (ppp) idle), Dial |
| (starting to trigger a call) and Drop (dropping a call) if you're using |
| PPPoE or PPTP encapsulation. This field displays Down when the line |
| is disconnected. |
| For the WLAN, it displays the maximum transmission rate when the |
| WLAN is enabled and Down when the WLAN is disabled. |
|
|
TxPkts | This is the number of transmitted packets on this port. |
|
|
RxPkts | This is the number of received packets on this port. |
|
|
Collisions | This is the number of collisions on this port. |
|
|
Tx B/s | This displays the transmission speed in bytes per second on this port. |
|
|
Rx B/s | This displays the reception speed in bytes per second on this port. |
|
|
System Up Time | This is the total time the |
|
|
Poll Interval(s) | Enter the time interval for refreshing statistics in this field. |
|
|
Set Interval | Click this button to apply the new poll interval you entered in the Poll |
| Interval(s) field. |
|
|
Stop | Click Stop to stop refreshing statistics. |
|
|
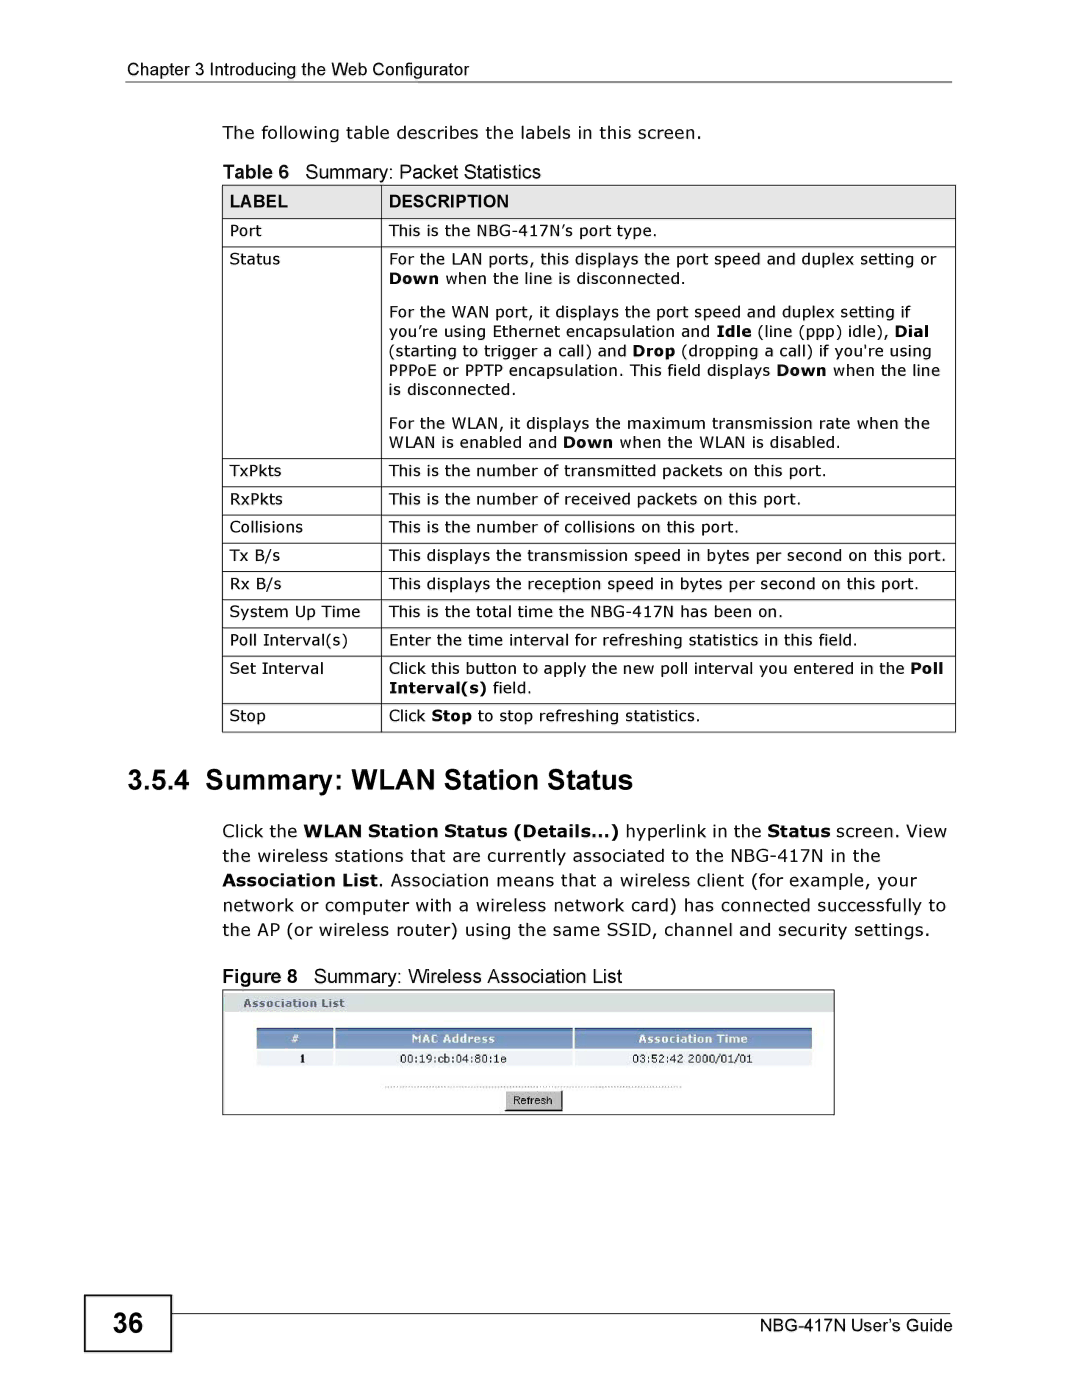
3.5.4 Summary: WLAN Station Status
Click the WLAN Station Status (Details...) hyperlink in the Status screen. View the wireless stations that are currently associated to the
Figure 8 Summary: Wireless Association List
36
