1 Getting Started Tutorial
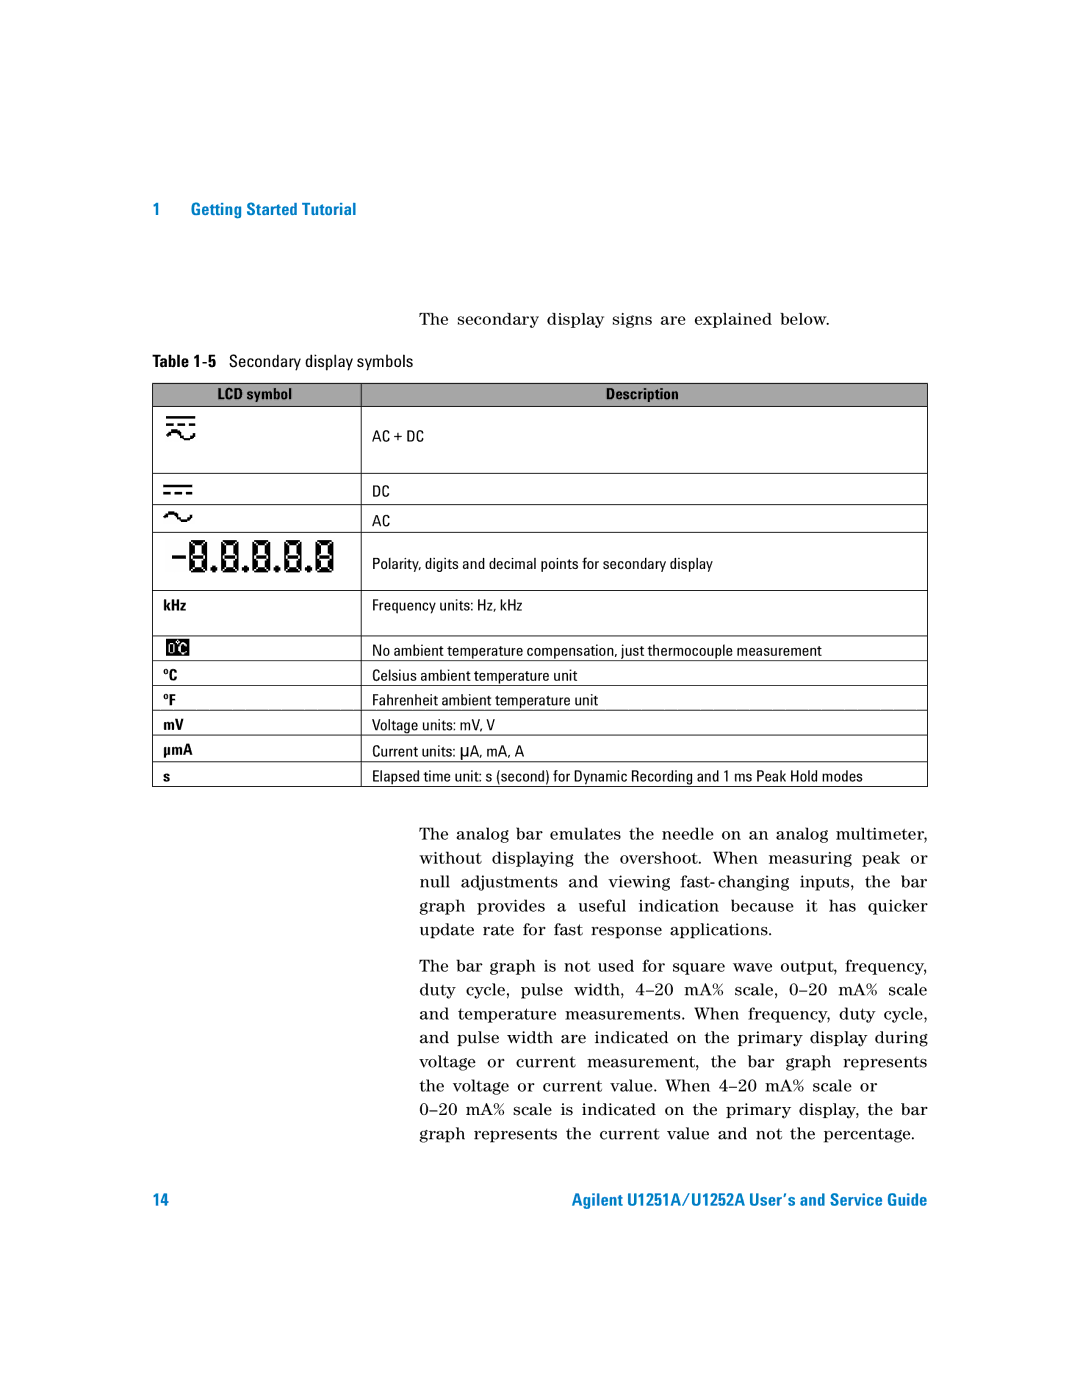
| The secondary display signs are explained below. |
Table | |
|
|
LCD symbol | Description |
| AC + DC |
|
|
| DC |
|
|
| AC |
|
|
| Polarity, digits and decimal points for secondary display |
|
|
kHz | Frequency units: Hz, kHz |
|
|
| No ambient temperature compensation, just thermocouple measurement |
ºC | Celsius ambient temperature unit |
ºF | Fahrenheit ambient temperature unit |
mV | Voltage units: mV, V |
µmA | Current units: µA, mA, A |
s | Elapsed time unit: s (second) for Dynamic Recording and 1 ms Peak Hold modes |
The analog bar emulates the needle on an analog multimeter, without displaying the overshoot. When measuring peak or null adjustments and viewing fast- changing inputs, the bar graph provides a useful indication because it has quicker update rate for fast response applications.
The bar graph is not used for square wave output, frequency, duty cycle, pulse width,
14 | Agilent U1251A/U1252A User’s and Service Guide |
