4220 Flow Meter
Section 1 Introduction
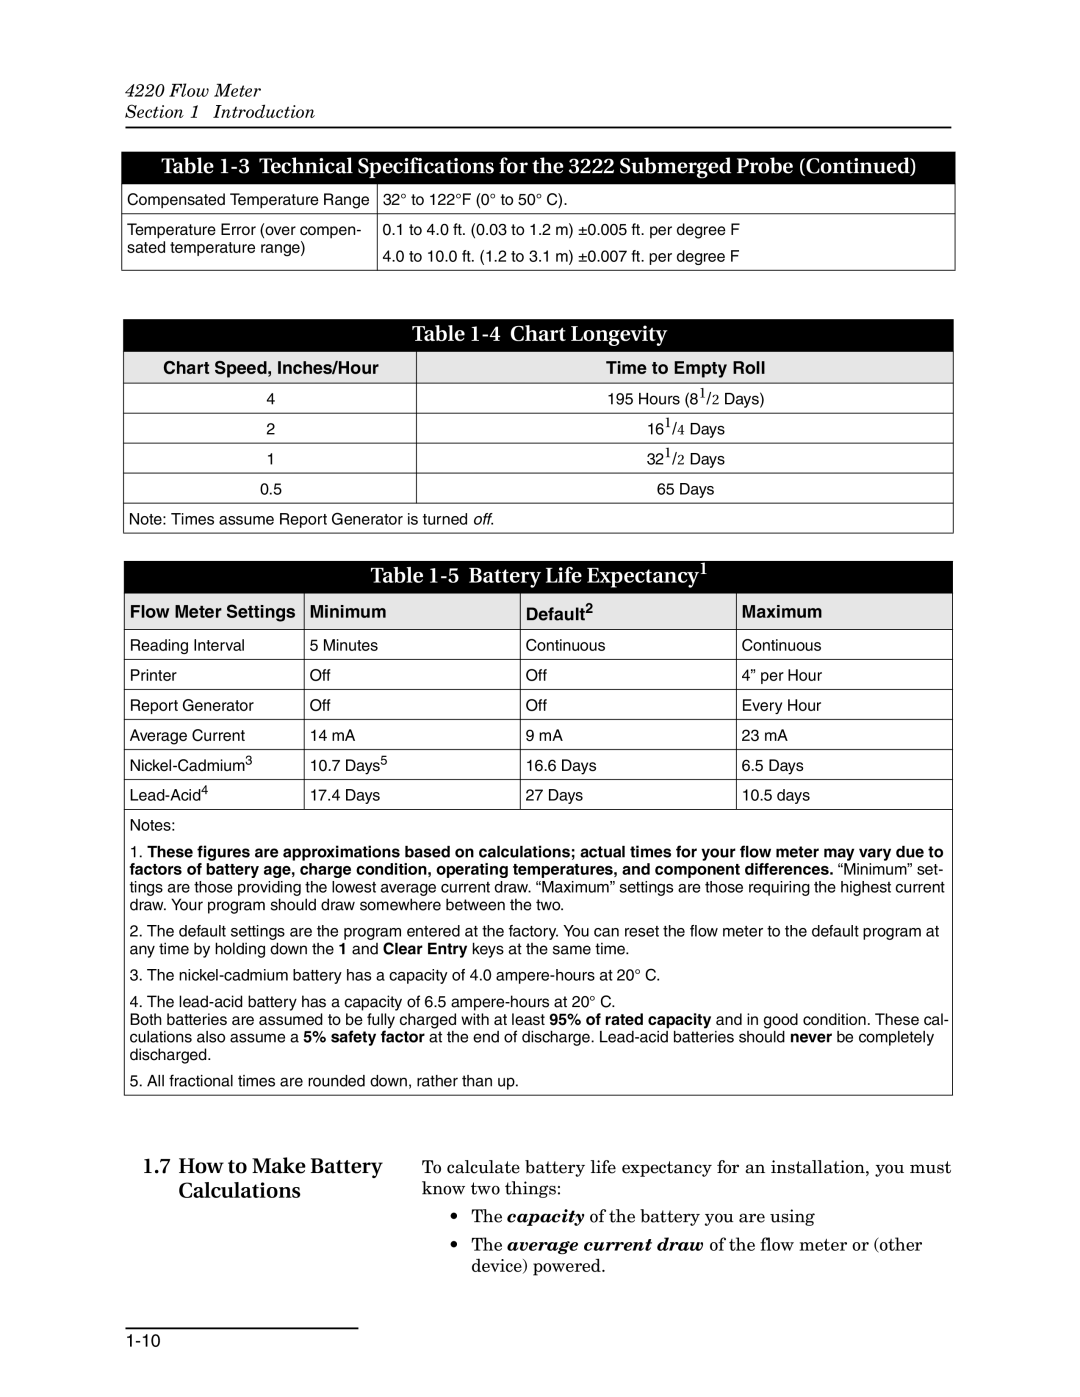
Table 1-3 Technical Specifications for the 3222 Submerged Probe (Continued)
Compensated Temperature Range 32° to 122°F (0° to 50° C). | |
Temperature Error (over compen- 0.1 to 4.0 ft. (0.03 to 1.2 m) ±0.005 ft. per degree F | |
sated temperature range) | 4.0 to 10.0 ft. (1.2 to 3.1 m) ±0.007 ft. per degree F |
| |
| Table |
|
|
Chart Speed, Inches/Hour | Time to Empty Roll |
4 | 195 Hours (81/2 Days) |
2 | 161/4 Days |
1 | 321/2 Days |
0.5 | 65 Days |
|
|
Note: Times assume Report Generator is turned off.
Table 1-5 Battery Life Expectancy1
Flow Meter Settings | Minimum | Default2 | Maximum | |
Reading Interval | 5 Minutes | Continuous | Continuous | |
|
|
|
|
|
Printer | Off |
| Off | 4” per Hour |
|
|
|
|
|
Report Generator | Off |
| Off | Every Hour |
|
|
|
| |
Average Current | 14 mA | 9 mA | 23 mA | |
|
|
|
|
|
10.7 | Days5 | 16.6 Days | 6.5 Days | |
17.4 | Days | 27 Days | 10.5 days | |
Notes:
1. These figures are approximations based on calculations; actual times for your flow meter may vary due to
factors of battery age, charge condition, operating temperatures, and component differences. “Minimum” set- tings are those providing the lowest average current draw. “Maximum” settings are those requiring the highest current draw. Your program should draw somewhere between the two.
2. The default settings are the program entered at the factory. You can reset the flow meter to the default program at any time by holding down the 1 and Clear Entry keys at the same time.
3. The
4. The
Both batteries are assumed to be fully charged with at least 95% of rated capacity and in good condition. These cal- culations also assume a 5% safety factor at the end of discharge.
5. All fractional times are rounded down, rather than up.
1.7How to Make Battery Calculations
To calculate battery life expectancy for an installation, you must know two things:
•The capacity of the battery you are using
•The average current draw of the flow meter or (other device) powered.