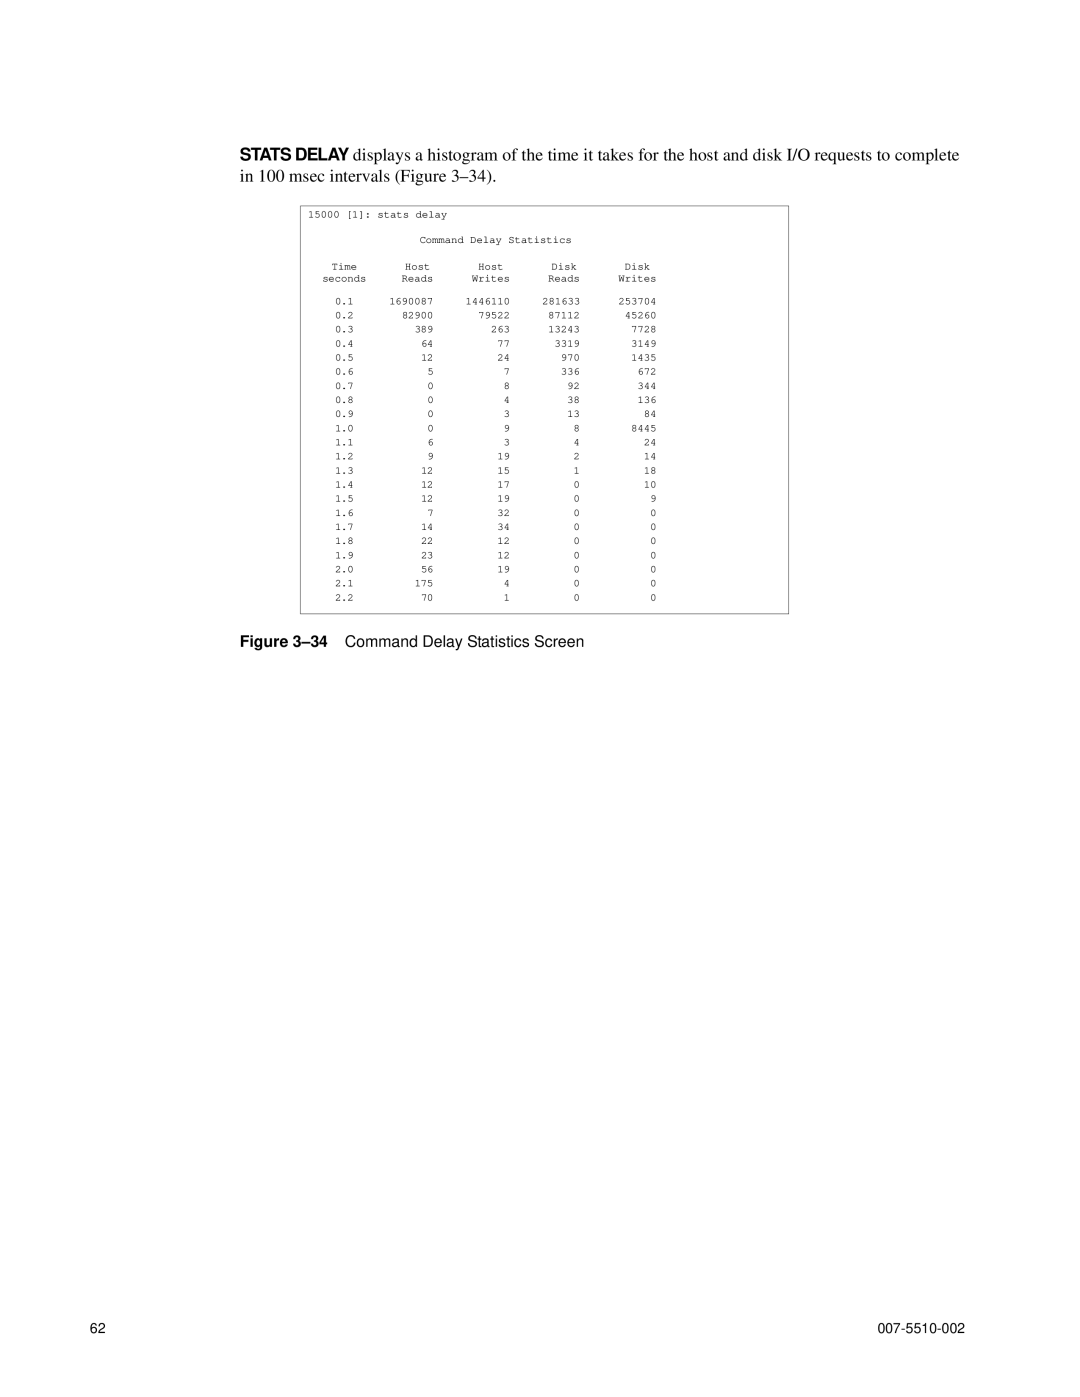
STATS DELAY displays a histogram of the time it takes for the host and disk I/O requests to complete in 100 msec intervals (Figure
15000 [1]: stats delay |
|
|
| |
| Command Delay Statistics |
| ||
Time | Host | Host | Disk | Disk |
seconds | Reads | Writes | Reads | Writes |
0.1 | 1690087 | 1446110 | 281633 | 253704 |
0.2 | 82900 | 79522 | 87112 | 45260 |
0.3 | 389 | 263 | 13243 | 7728 |
0.4 | 64 | 77 | 3319 | 3149 |
0.5 | 12 | 24 | 970 | 1435 |
0.6 | 5 | 7 | 336 | 672 |
0.7 | 0 | 8 | 92 | 344 |
0.8 | 0 | 4 | 38 | 136 |
0.9 | 0 | 3 | 13 | 84 |
1.0 | 0 | 9 | 8 | 8445 |
1.1 | 6 | 3 | 4 | 24 |
1.2 | 9 | 19 | 2 | 14 |
1.3 | 12 | 15 | 1 | 18 |
1.4 | 12 | 17 | 0 | 10 |
1.5 | 12 | 19 | 0 | 9 |
1.6 | 7 | 32 | 0 | 0 |
1.7 | 14 | 34 | 0 | 0 |
1.8 | 22 | 12 | 0 | 0 |
1.9 | 23 | 12 | 0 | 0 |
2.0 | 56 | 19 | 0 | 0 |
2.1 | 175 | 4 | 0 | 0 |
2.2 | 70 | 1 | 0 | 0 |
|
|
|
|
|
Figure 3–34 Command Delay Statistics Screen
62 |