Controller Management
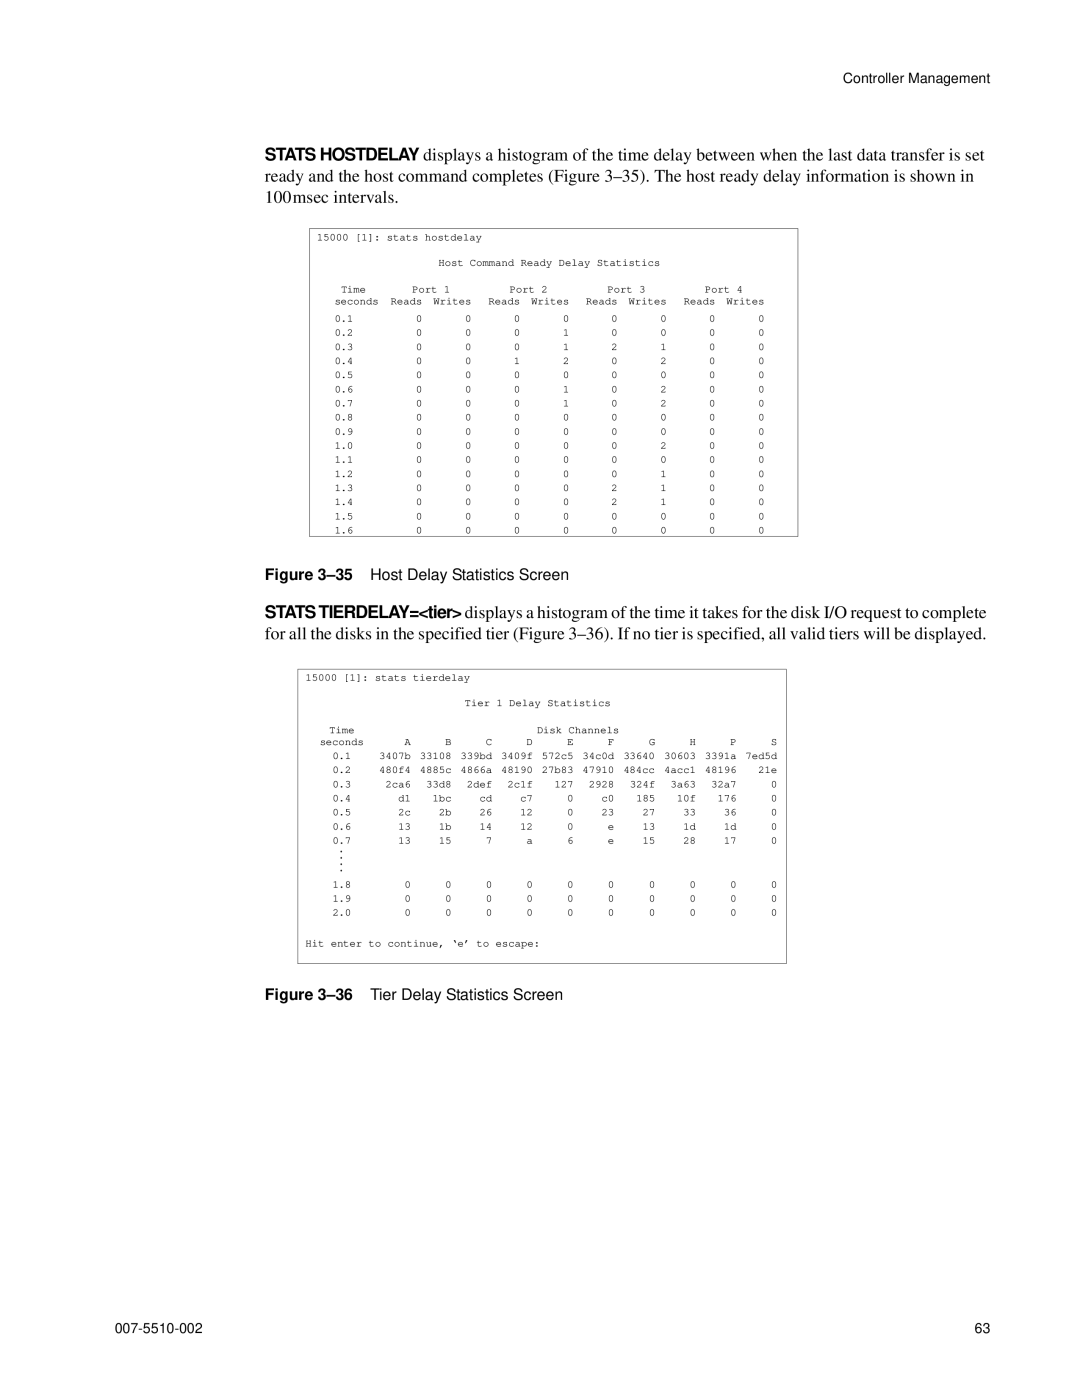
STATS HOSTDELAY displays a histogram of the time delay between when the last data transfer is set ready and the host command completes (Figure
15000 [1]: stats hostdelay |
|
|
|
|
|
| ||
|
| Host Command Ready Delay Statistics |
|
| ||||
Time | Port 1 | Port 2 | Port 3 | Port 4 | ||||
seconds | Reads | Writes | Reads | Writes | Reads | Writes | Reads | Writes |
0.1 | 0 | 0 | 0 | 0 | 0 | 0 | 0 | 0 |
0.2 | 0 | 0 | 0 | 1 | 0 | 0 | 0 | 0 |
0.3 | 0 | 0 | 0 | 1 | 2 | 1 | 0 | 0 |
0.4 | 0 | 0 | 1 | 2 | 0 | 2 | 0 | 0 |
0.5 | 0 | 0 | 0 | 0 | 0 | 0 | 0 | 0 |
0.6 | 0 | 0 | 0 | 1 | 0 | 2 | 0 | 0 |
0.7 | 0 | 0 | 0 | 1 | 0 | 2 | 0 | 0 |
0.8 | 0 | 0 | 0 | 0 | 0 | 0 | 0 | 0 |
0.9 | 0 | 0 | 0 | 0 | 0 | 0 | 0 | 0 |
1.0 | 0 | 0 | 0 | 0 | 0 | 2 | 0 | 0 |
1.1 | 0 | 0 | 0 | 0 | 0 | 0 | 0 | 0 |
1.2 | 0 | 0 | 0 | 0 | 0 | 1 | 0 | 0 |
1.3 | 0 | 0 | 0 | 0 | 2 | 1 | 0 | 0 |
1.4 | 0 | 0 | 0 | 0 | 2 | 1 | 0 | 0 |
1.5 | 0 | 0 | 0 | 0 | 0 | 0 | 0 | 0 |
1.6 | 0 | 0 | 0 | 0 | 0 | 0 | 0 | 0 |
Figure 3–35 Host Delay Statistics Screen
STATS TIERDELAY=<tier> displays a histogram of the time it takes for the disk I/O request to complete for all the disks in the specified tier (Figure
15000 [1]: stats tierdelay |
|
|
|
|
|
|
| |||
|
|
| Tier 1 Delay Statistics |
|
|
|
| |||
Time | A | B | C | D | Disk Channels | G | H | P | S | |
seconds | E | F | ||||||||
0.1 | 3407b | 33108 | 339bd | 3409f | 572c5 | 34c0d | 33640 | 30603 | 3391a | 7ed5d |
0.2 | 480f4 | 4885c | 4866a | 48190 | 27b83 | 47910 | 484cc | 4acc1 | 48196 | 21e |
0.3 | 2ca6 | 33d8 | 2def | 2c1f | 127 | 2928 | 324f | 3a63 | 32a7 | 0 |
0.4 | d1 | 1bc | cd | c7 | 0 | c0 | 185 | 10f | 176 | 0 |
0.5 | 2c | 2b | 26 | 12 | 0 | 23 | 27 | 33 | 36 | 0 |
0.6 | 13 | 1b | 14 | 12 | 0 | e | 13 | 1d | 1d | 0 |
0.7 | 13 | 15 | 7 | a | 6 | e | 15 | 28 | 17 | 0 |
.... | 0 | 0 | 0 | 0 | 0 | 0 | 0 | 0 | 0 | 0 |
1.8 | ||||||||||
1.9 | 0 | 0 | 0 | 0 | 0 | 0 | 0 | 0 | 0 | 0 |
2.0 | 0 | 0 | 0 | 0 | 0 | 0 | 0 | 0 | 0 | 0 |
Hit enter to continue, ‘e’ to escape:
Figure 3–36 Tier Delay Statistics Screen
63 |