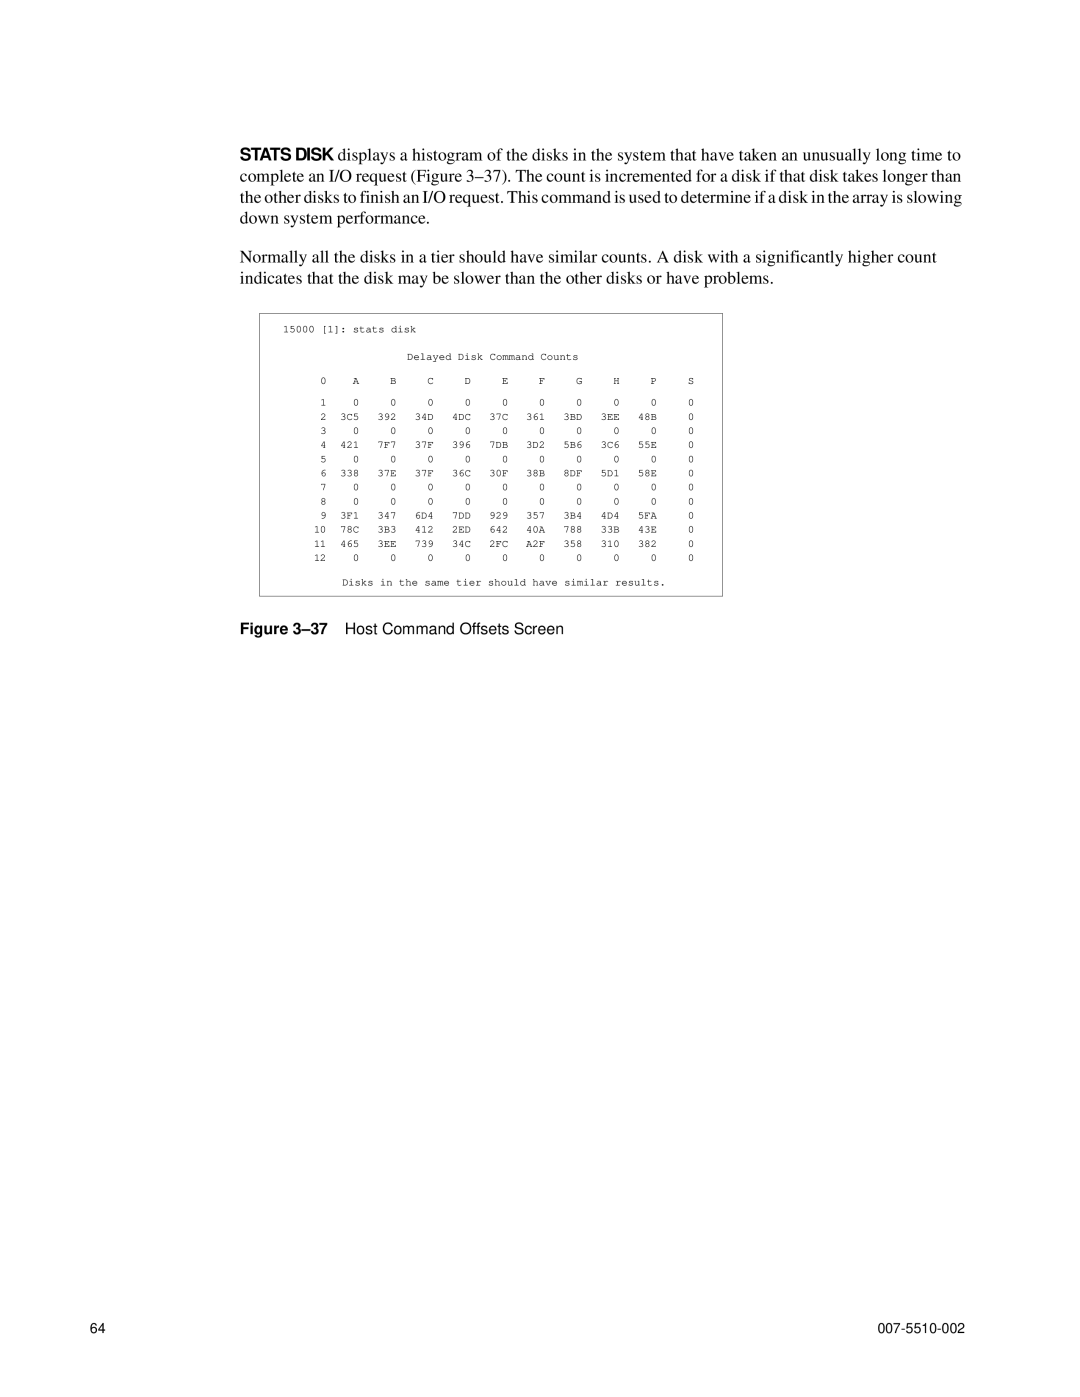
STATS DISK displays a histogram of the disks in the system that have taken an unusually long time to complete an I/O request (Figure
Normally all the disks in a tier should have similar counts. A disk with a significantly higher count indicates that the disk may be slower than the other disks or have problems.
15000 [1]: stats disk |
|
|
|
|
|
|
| |||
|
|
| Delayed Disk Command Counts |
|
|
| ||||
0 | A | B | C | D | E | F | G | H | P | S |
1 | 0 | 0 | 0 | 0 | 0 | 0 | 0 | 0 | 0 | 0 |
2 | 3C5 | 392 | 34D | 4DC | 37C | 361 | 3BD | 3EE | 48B | 0 |
3 | 0 | 0 | 0 | 0 | 0 | 0 | 0 | 0 | 0 | 0 |
4 | 421 | 7F7 | 37F | 396 | 7DB | 3D2 | 5B6 | 3C6 | 55E | 0 |
5 | 0 | 0 | 0 | 0 | 0 | 0 | 0 | 0 | 0 | 0 |
6 | 338 | 37E | 37F | 36C | 30F | 38B | 8DF | 5D1 | 58E | 0 |
7 | 0 | 0 | 0 | 0 | 0 | 0 | 0 | 0 | 0 | 0 |
8 | 0 | 0 | 0 | 0 | 0 | 0 | 0 | 0 | 0 | 0 |
9 | 3F1 | 347 | 6D4 | 7DD | 929 | 357 | 3B4 | 4D4 | 5FA | 0 |
10 | 78C | 3B3 | 412 | 2ED | 642 | 40A | 788 | 33B | 43E | 0 |
11 | 465 | 3EE | 739 | 34C | 2FC | A2F | 358 | 310 | 382 | 0 |
12 | 0 | 0 | 0 | 0 | 0 | 0 | 0 | 0 | 0 | 0 |
Disks in the same tier should have similar results.
Figure 3–37 Host Command Offsets Screen
64 |
