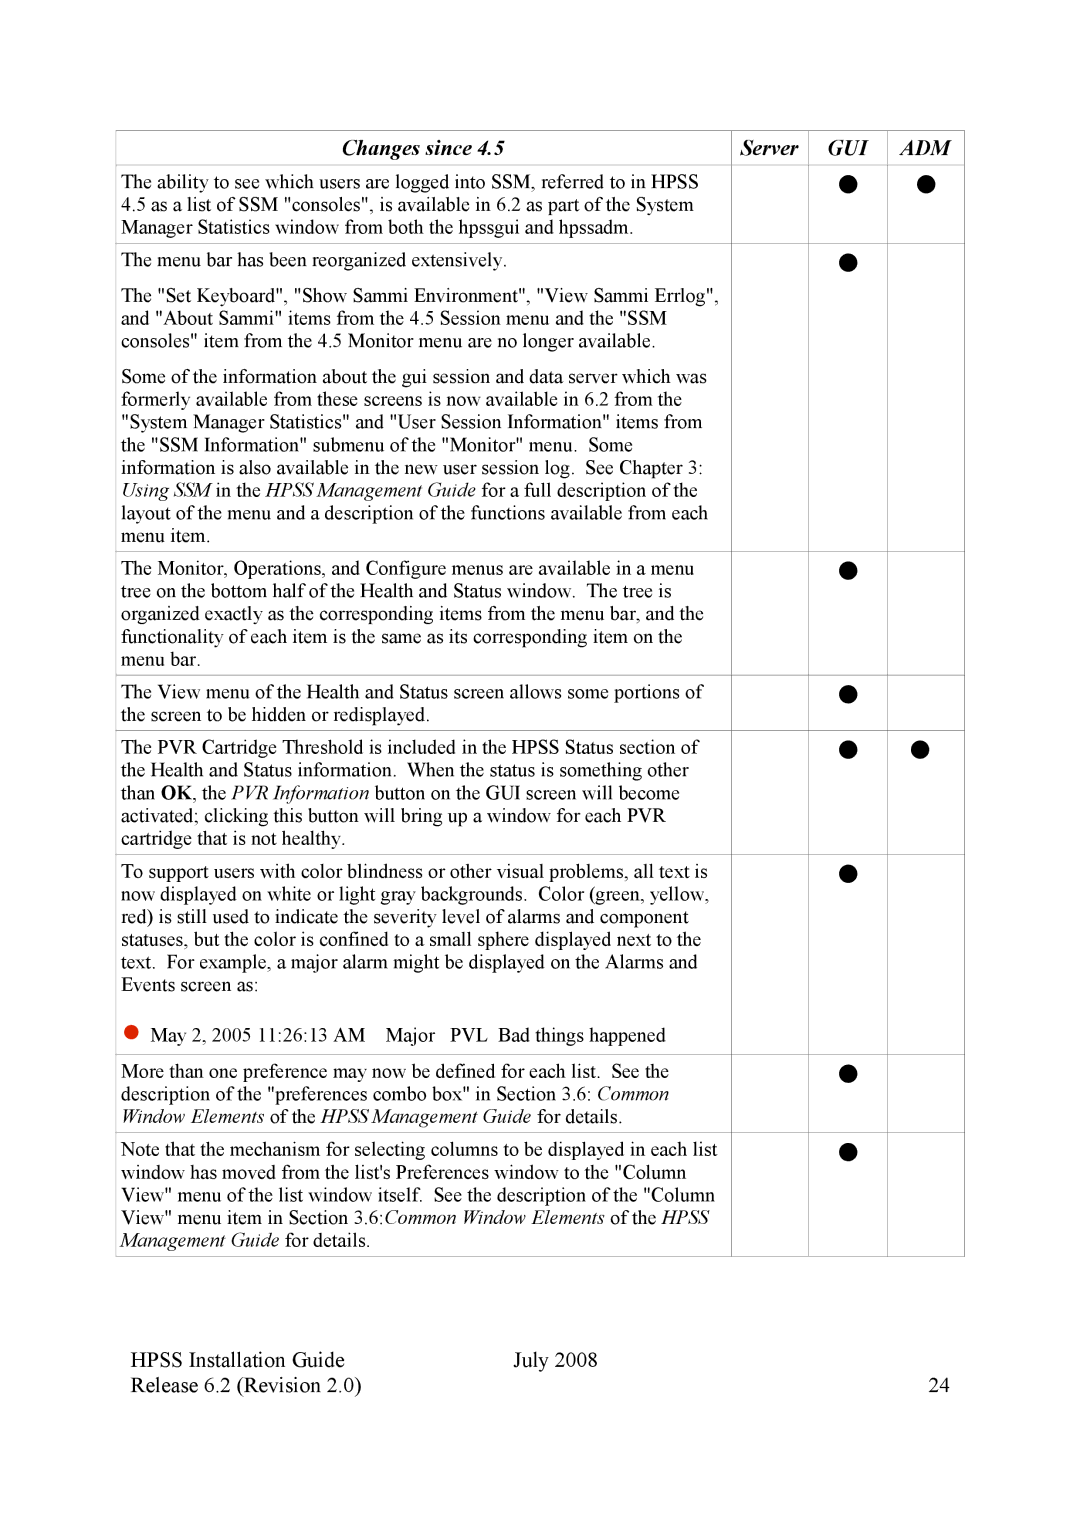
Changes since 4.5 | Server | GUI | ADM |
|
|
|
|
The ability to see which users are logged into SSM, referred to in HPSS |
| n | n |
4.5 as a list of SSM "consoles", is available in 6.2 as part of the System |
|
|
|
Manager Statistics window from both the hpssgui and hpssadm. |
|
|
|
The menu bar has been reorganized extensively. |
| n |
|
The "Set Keyboard", "Show Sammi Environment", "View Sammi Errlog", |
|
|
|
and "About Sammi" items from the 4.5 Session menu and the "SSM |
|
|
|
consoles" item from the 4.5 Monitor menu are no longer available. |
|
|
|
Some of the information about the gui session and data server which was |
|
|
|
formerly available from these screens is now available in 6.2 from the |
|
|
|
"System Manager Statistics" and "User Session Information" items from |
|
|
|
the "SSM Information" submenu of the "Monitor" menu. Some |
|
|
|
information is also available in the new user session log. See Chapter 3: |
|
|
|
Using SSM in the HPSS Management Guide for a full description of the |
|
|
|
layout of the menu and a description of the functions available from each |
|
|
|
menu item. |
|
|
|
|
|
|
|
The Monitor, Operations, and Configure menus are available in a menu |
| n |
|
tree on the bottom half of the Health and Status window. The tree is |
|
|
|
organized exactly as the corresponding items from the menu bar, and the |
|
|
|
functionality of each item is the same as its corresponding item on the |
|
|
|
menu bar. |
|
|
|
The View menu of the Health and Status screen allows some portions of |
| n |
|
the screen to be hidden or redisplayed. |
|
|
|
The PVR Cartridge Threshold is included in the HPSS Status section of |
| n | n |
the Health and Status information. When the status is something other |
|
|
|
than OK, the PVR Information button on the GUI screen will become |
|
|
|
activated; clicking this button will bring up a window for each PVR |
|
|
|
cartridge that is not healthy. |
|
|
|
To support users with color blindness or other visual problems, all text is |
| n |
|
now displayed on white or light gray backgrounds. Color (green, yellow, |
|
|
|
red) is still used to indicate the severity level of alarms and component |
|
|
|
statuses, but the color is confined to a small sphere displayed next to the |
|
|
|
text. For example, a major alarm might be displayed on the Alarms and |
|
|
|
Events screen as: |
|
|
|
● May 2, 2005 11:26:13 AM Major PVL Bad things happened |
|
|
|
|
|
|
|
More than one preference may now be defined for each list. See the |
| n |
|
description of the "preferences combo box" in Section 3.6: Common |
|
|
|
Window Elements of the HPSS Management Guide for details. |
|
|
|
Note that the mechanism for selecting columns to be displayed in each list |
| n |
|
window has moved from the list's Preferences window to the "Column |
|
|
|
View" menu of the list window itself. See the description of the "Column |
|
|
|
View" menu item in Section 3.6:Common Window Elements of the HPSS |
|
|
|
Management Guide for details. |
|
|
|
HPSS Installation Guide | July 2008 |
Release 6.2 (Revision 2.0) | 24 |
