Q
3 – SANbox SSP Management GUI Reference Navigating the SANbox SSP Management GUI
3.2.2
Diagnostics
The Diagnostics screen provides statistics for various aspects of the system.
To use the Diagnostics panel:
1.Select an object type:
■Port
■Virtual Volume
2.Select a value for the object, such as port number if the object is port.
3.Select a variable to graph.
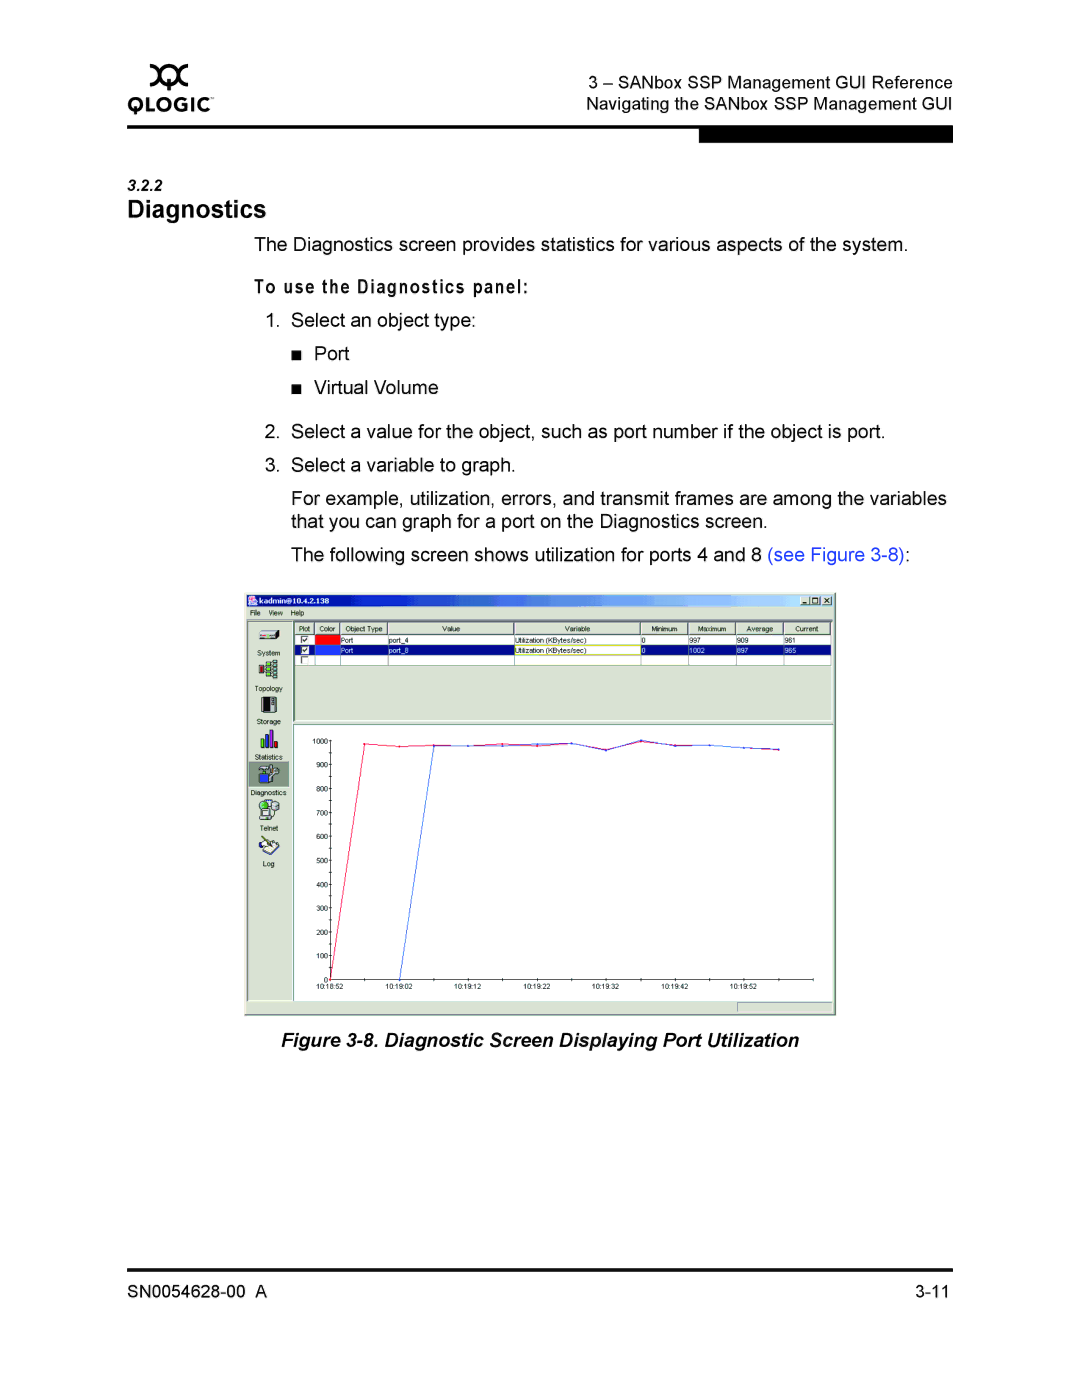
For example, utilization, errors, and transmit frames are among the variables that you can graph for a port on the Diagnostics screen.
The following screen shows utilization for ports 4 and 8 (see Figure
