OTS
USA
Warranty
Page
Table of Contents
Analysis SONET/T1M1 Analysis SDH/G.826
Reference
Iii
SOURceDATAPAYLoadBACKgroundPATTern
Appendices
How to Avoid Fire or Personal Injury
General Safety Summary
Keep Product Surfaces Clean and Dry
General Safety Summary
Terms on the Product
Safety Terms and Symbols
Symbols on the Product
Terms in this Manual
General Safety Summary Viii
How This Manual is Organized
Preface
Conventions
Product Description
Getting Started
OTS9100 Features and Capabilities
Getting Started
OTS91L5 Standard
Accessories
Standard with each shipment
OTS91L4 Standard
OTS91T3 Standard
OTS91L7 Standard
OTS91L8 Standard
OTS91R2 Standard
Adapters, SMA
International Power Plug Options Chassis Only
First Operation
OTS9100 Installation
Removing Cards
Multiple Modules
Slot Positioning of OTS Cards
OTS9000 with card slot assignment
Module Card Interconnection
Proper location Interconnection cables
Power On and Software Initialization
Transmitter Setup
Receiver Setup
Module Quick Check
Getting Started
Emergency Startup Disk
Shutdown and Power Off
OTS9100 Front Panel
Front Panel Indicators and Connectors
10Gb/s Transceiver Optics
Module OK
Optical OUT
Appropriate circuit. -3 1550 nm Transceiver Front Panel
Optical
Rx Data OUT
Tx Data
Laser Lockout, Remote Interlock
Defect indicator will turn off when a new test is started
Receive Analysis
Module OK
Rx Event OUT
Rx Data
Rx Clock OUT
Transmit Generation
Tx Event OUT
Transmit Front Panel
MHz Trig OUT
Tx Data OUT
GHz Clock
Rx Clock
Clock Trigger
MHz External Clock
GHz Trig OUT
GHz Clock Out
Software Interface Operating Basics
Elements of the User Interface
View
Task Bar
Menu Bar
System
Window
Single Mode
Multiple Mode
Multiple Window Mode View
Laser Control Bar
Tool Bar
Client Lockout
Error
Test Control Bar
Main Status Bar
Test
Laser Off
Frame Grabbers
LED Window
Clear History
Module Signal Summary LED Panel
Slot Signal LED Panel
User Selected Signal LED Window
LED Module Display
Module LED Panel
SEF OOF
Description of Status Window Virtual LED Indicators
LED Display Selection
Select Signal User Selected Signal Slot Signal
Navigation Window
Summary Icons
Scroll Buttons
Setup Property Menus
10 Transmitter Setup Signal menu
Signal Standard
Trigger Output
Bert Mode
Signal Source
Timing Source
SPE/VC3 Stuff Column Control
Packet Over Sonet POS
Background Channels
11 Transmitter Transport Overhead menu
Transmitter Transport Overhead
12 Edit Overhead dialog box
Edit Overhead
13 Through Mode Overwrite menu
Through Mode
14 Transmitter J0 Trace dialog box
J0 Multi-Byte Trace
16 Transmitter Path Overhead Property Menu
Transmitter Path Overhead
Edit Path Overhead
Path Through Mode
19 Transmitter J1 Trace dialog box
J1 Multi-Byte Trace
21 Transmitter Error Insertion menu
Transmitter Error Insertion
Anomaly Insertion
Anomaly Insertion and Through Mode
Defect Insertion
23 Defect Insertion of the Error Insertion menu
24 Transmitter K1, K2 Decode menu
Transmitter K1, K2 Decode
25 Edit K1, K2 Bytes dialog box
Operating Basics User Interface
Transmitter IP Payload
IP Setup
IP Header
Error Selection
Transmitter IP Error Insertion
Current Error Insertion
26 Receiver Setup Signal menu
Receiver Signal
Test Pattern
Signal Structure
27 Receiver Threshold Offset dialog box
Receiver Threshold Offset
Receiver Trace Mismatch
28 Receiver Setup Trace Mismatch menu
29 J0 Trace Editor dialog box
Edit C2 Byte
31 Edit C2 dialog box
Hpplm and HP Unequipped Detection
Receiver IP Setup
32 Setup Summary menu
Setup Summary
Receiver Transport Overhead
Signal Monitor Menus
S1 Synchronization Status
RS Trace Section Trace J0
Receiver Path Overhead
35 Signal Monitor Path Overhead
C2 Status
Path Trace J1
Receiver K1,K2 Decode
36 Signal Monitor K1,K2 Decode
Receiver Payload
37 Signal Monitor Payload
Test Control Menu
39 Test Control Parameters dialog box
40 Test Control Summary menu
Test Control Summary
Receiver Real-Time
Measurements Menu
42 Real-Time menu Path display
44 Cumulative Measurements Display Section and Line
Receiver Cumulative
45 Cumulative Measurements Display Path
46 Example of Results History Data Section/Line
Receiver History
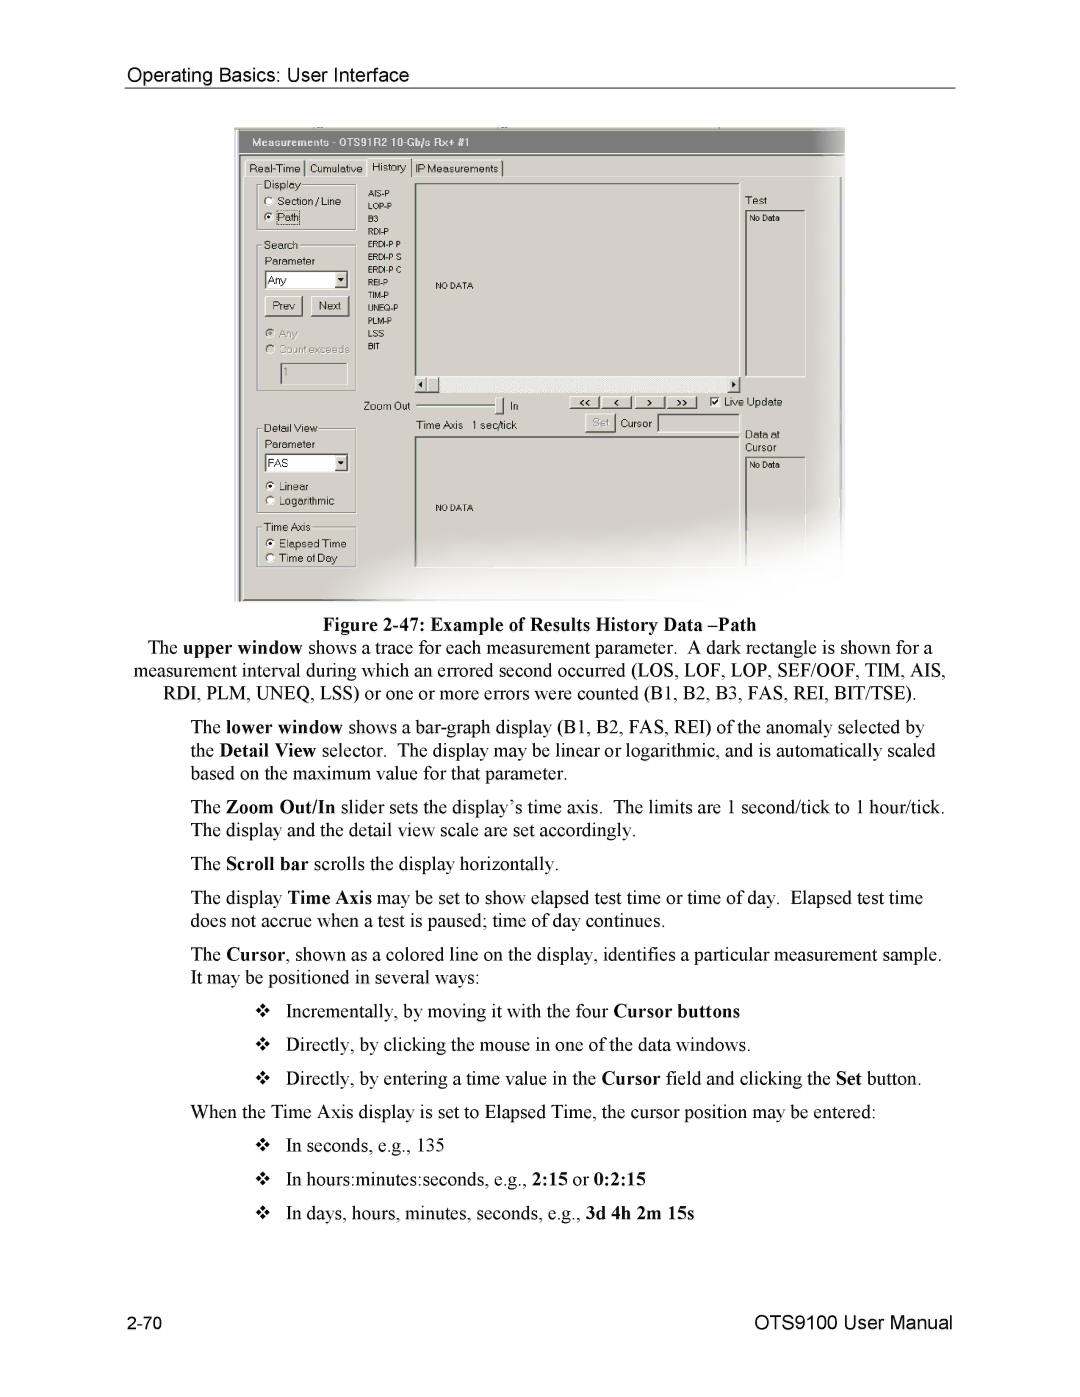
47 Example of Results History Data -Path
Operating Basics User Interface
Receiver IP Measurements display
Receiver IP Measurements
Transmitter IP Measurements
Analysis SONET/T1M1
Analysis Menu
49 Analysis menu SONET/T1M1 Path
50 Analysis menu SDH/G.826 RS/MS
Analysis SDH/G.826
51 Analysis menu SDH/G.826 Path
52 APS Measurements menu
APS Measurements Menu
53 Set APS Test Parameters dialog box
54 Copy APS Measurement Data dialog box
Remote Access Setups
Select Server
59 View Options dialog box
Display Notation
Server System
Display Configuration
System View
63 View Scpi Output dialog box
Scpi Output
Results File Management
Results Files
64 Results File Management dialog box
On the Local computer
ResultsViewer
Operation
Opening files on the local computer
65 Cumulative Results screen of the ResultsViewer
Connecting to an OTS System Viewing results files
Exporting test data to other programs
Configuring ResultsViewer
Selecting and arranging windows
Printing results data
Sample output of data from a test results file
A202
A604
Summary report Test file info
Record type codes
Sonet GR-253 Line Analysis
History data
66 Configure Data Report dialog box
Configuring the exported data
Starting the Event Printer program
Logging
Select Events
Clear
Copy to Clipboard
Copy to File
Copy to Printer
Configuring a printer in Windows
Muting Event Printer behavior with continuous events
Minimizing the Event Printer window
102
Commands Overview
Ieee 488.2 System Commands
Remote Control Setup and Format Commands
Remote Control Port Settings
Remote Control Lockout
System Configuration Queries
System File Management
Save and Restore System Settings
System Signal Standard OTS9100 module
Receiver Commands OTS9100 module
Receiver Signal Measurement Commands OTS9100 module
Receiver Signal Analysis Commands OTS9100 module
Receiver Test Control OTS9100 module
Transmitter Commands OTS9100 module
Description
Ieee 488.2 Common Commands
Command and Query Structure
Syntax
Hex Block Format
Block Format
Example
Scpi Commands and Queries
Command Format
Query format
Sourcedatapayloadpattern Enum
Parameter types and formats
#216ABCDEFGHIJKLMNOP
Optional and alternative parameters
Accepted short form
Abbreviating Commands, Queries, and Parameters
Controlling Responses to Queries
Minimum information needed
Example of chaining commands and queries
Chaining Commands and Queries
Slot Specifiers
General Rules
ESE
Command Description
OPC
SENSeANALysisG826AMSFARALL
SENSeANALysisG826AMSFAR
SENSeANALysisG826AMSNEAR
SENSeANALysisG826AMSNEARALL
SENSeANALysisG826APATHFAR
SENSeANALysisG826APATHFARALL
SENSeANALysisG826APATHNEAR
SENSeANALysisG826APATHNEARALL
SENSeANALysisG826ARS
SENSeANALysisG826ARSALL
SENSeANALysisGR253ALINEFAR
SENSeANALysisGR253ALINEFARALL
SENSeANALysisGR253ALINENEAR
SENSeANALysisGR253ALINENEARALL
SENSeANALysisGR253APATHFARALL
SENSeANALysisGR253APATHFAR
SENSeANALysisGR253APATHNEARALL
SENSeANALysisGR253APATHNEAR
SENSeANALysisGR253ASECTion
SENSeANALysisGR253ASECTionALL
SENSeANALysisPATHHPPLM
SENSeANALysisPATHTRACeEXPEcted
SENSeANALysisPATHHPPLMGENEric
SENSeANALysisPATHHPUNEQ
SENSeANALysisPATHLABElEXPEcted
SENSeANALysisPATHTRACeEXPEctedTYPE
SENSeANALysisPATHTRACeEXPEctedVALUe
SENSeANALysisPATHTRACeEXPEctedVALUeSTRIng
SENSeANALysisPATHTRACeTIM
SENSeANALysisSECTionTRACeEXPEcted
SENSeANALysisSECTionTRACeEXPEctedTYPE
SENSeDATAAUTOscanSTRUcture
SENSeANALysisSECTionTRACeEXPEctedVALUe
SENSeANALysisSECTionTRACeEXPEctedVALUeSTRIng
SENSeANALysisSECTionTRACeTIM
SENSeDATAIPSTReamINDEX
SENSeDATACHANnel
SENSeDATAIPPAYLoadPATTern
SENSeDATAIPPAYLoadPATTernUDATA
SENSeDATAPAYLoadPATTern
SENSeDATAPATHTRACeTYPE
SENSeDATAPATHTRACeVALUe
SENSeDATAPATHTRACeVALUeSTRIng
SENSeDATAPOHBYTEC2A
SENSeDATAPAYLoadPATTernUDATA
SENSeDATAPOHALL
SENSeDATAPOHBYTE
SENSeDATASECTionTRACeVALUe
SENSeDATARATE
SENSeDATASECTionTRACe
SENSeDATASECTionTRACeTYPE
SENSeDATATOHSTS1AALL
SENSeDATASPESTUFfing
SENSeDATASTRUcture
SENSeDATATOHSTM1AALL
SENSeINPUtTHREshold
SENSeINPutTHResholdLOS
SENSeMEASureAPSTimeCONDition
SENSeMEASureAPSTimeSTATus
SENSeMEASureAPSTimeRUN
SENSeMEASureAPSTimeDETEcted
SENSeMEASureAPSTimeMAXTime
SENSeMEASureHDLCFRAMesALL
SENSeMEASureAPSTimeTHREshold
SENSeMEASureAPSTimeVALUe
SENSeMEASureHDLCFRAMes
SENSeMEASureLINECUMUlative
SENSeMEASureHDLCBYTes
SENSeMEASureIPPACKets
SENSeMEASureIPPACKetsALL
SENSeMEASureLINEWINDow
SENSeMEASureLINEWINDowALL
SENSeMEASurePATHCUMUlative
SENSeMEASurePATHCUMUlativeALL
SENSeMEASurePATHWINDow
SENSeMEASurePATHWINDowALL
SENSeMEASureSECTionCUMUlative
SENSeMEASureSECTionCUMUlativeALL
SENSeMEASureSECTionWINDow
SENSeMEASureWINDowSIZE
SENSeMEASureSECTionWINDowALL
SENSeMEASureWINDowCLEAR
SENSeMEASureWINDowLEVEL
SENSeSIGNalSTANdard
SENSeOPTicalTHResholdAUTO
SENSeOVERheadMONItorCHANnel
SENSeSTATusLEDS
SENSeSTATusLEDSHEXadecimal
SENSeSTATusLEDSNUMEric
SENSeSTATusPATHLEDS
SENSeSTATusPATHLEDSHEXadecimal
SENSeSTATusPATHLEDSNUMEric
SENSeTESTTIME
SENSeTESTDESCription
SENSeTESTMODE
SENSeTESTSTATe
SOURceDATABACKgroundSTRUcture
SENSeTESTTIMEELAPsed
SENSeTRIGgerMODE
SOURceCLOCkSOURce
SOURceDATAIPHEADerADDRessDEST
SOURceDATACHANnel
SOURceDATACHANnelREPLicate
SOURceDATAHDLCIFRameGAP
SOURceDATAIPHEADerPROTocol
SOURceDATAIPHEADerFLAG
SOURceDATAIPHEADerFRAGOFFSet
SOURceDATAIPHEADerID
SOURceDATAIPPAYLoadPATTern
SOURceDATAIPHEADerTSERVice
SOURceDATAIPHEADerTTLive
SOURceDATAIPHEADerVERSion
SOURceDATAOVERheadPASSthru
SOURceDATAIPSTReamINDEX
SOURceDATAIPTRAFfic
SOURceDATAPOSSCRambling
SOURceDATAOVERheadPASSthruALL
SOURceDATAPARItyLOOP
SOURceDATAPATHOVERheadPASSthru
SOURceDATAPATHOVERheadPASSthruALL
SOURceDATAPATHTRACe
SOURceDATAPATHTRACeTYPE
SOURceDATAPATHTRACeVALUe
SOURceDATAPATHTRACeVALUeSTRIng
SOURceDATAPAYLoadBACKgroundPATTern
SOURceDATAPAYLoadBACKgroundPATTernUDATA
SOURceDATAPAYLoadPATTern
SOURceDATAPAYLoadPATTernUDATA
SOURceDATAPOHBYTEC2A
SOURceDATAPOHALL
SOURceDATAPOHBACKgroundBYTEC2A
SOURceDATAPOHBYTE
SOURceDATASECTionTRACeTYPE
SOURceDATAPOHDEFAult
SOURceDATARATE
SOURceDATASECTionTRACe
SOURceDATASPEBACKgroundSTUFfing
SOURceDATASECTionTRACeVALUe
SOURceDATASECTionTRACeVALUeSTRIng
SOURceDATASOURce
SOURceDATATOHSTS1ABYTE
SOURceDATASPESTUFfing
SOURceDATASTRUcture
SOURceDATATOHSTS1AALL
SOURceINSErtANOMalyRATERANGe
SOURceDATATOHSTS1ADEFAult
SOURceINSErtANOMalyMODE
SOURceINSErtANOMalyRATE
SOURceINSErtANOMalyREPLicateB2A
SOURceINSErtANOMalySTATe
SOURceINSErtANOMalyTYPE
SOURceINSErtDEFEctMODE
SOURceINSErtDEFEctSTATe
SOURceINSErtDEFEctTIME
SOURceINSErtDEFEctTIMERANGe
SOURceINSErtDEFEctTYPE
SOURceINSertIPANOMalyMODE
SOURceMEASureHDLCBYTes
SOURceINSertIPANOMalyRATE
SOURceINSertIPANOMalyRATERANGe
SOURceINSertIPANOMalyTYPE
SOURceMEASureIPPACKetsALL
SOURceMEASureHDLCFRAMes
SOURceMEASureHDLCFRAMesALL
SOURceMEASureIPPACKets
SOURceOUTPutLASerINFOWAVelength
SOURceSIGNalSTANdard
SOURceOUTPutLASerINFOOPTion
SOURceOUTPutLASerINFOSERial
SYSTemCOMMunicateGPIBSECOndary
STATusPRESet
SOURceTRIGgerMODE
SYSTemCOMMunicateGPIBPRIMary
SYSTemCOMMunicateNETWorkRXTERM
SYSTemCOMMunicateNETWorkECHO
SYSTemCOMMunicateNETWorkIPPORT
SYSTemCOMMunicateNETWorkPROMpt
SYSTemCOMMunicateNETWorkTXTERM
SYSTemCOMMunicatePORTECHO
SYSTemCOMMunicatePORTPROMpt
SYSTemCOMMunicatePORTRXTERM
SYSTemCOMMunicatePORTTXTERM
SYSTemCOMMunicateSERIalCOM1ADTR
SYSTemCOMMunicateSERIalCOM1AENABle
SYSTemCOMMunicateSERIalCOM1AECHO
SYSTemCOMMunicateSERIalCOM1AFLOW
SYSTemCOMMunicateSERIalCOM1ANDATA
SYSTemCOMMunicateSERIalCOM1ANSTOP
SYSTemCOMMunicateSERIalCOM1APARIty
SYSTemCOMMunicateSERIalCOM1ARXTERM
SYSTemCOMMunicateSERIalCOM1APROMpt
SYSTemCOMMunicateSERIalCOM1ARATE
SYSTemCOMMunicateSERIalCOM1ARTS
SYSTemCOMMunicateSERIalCOM2AECHO
SYSTemCOMMunicateSERIalCOM2AENABle
SYSTemCOMMunicateSERIalCOM1ATXTERM
SYSTemCOMMunicateSERIalCOM2ADTR
SYSTemCOMMunicateSERIalCOM2AFLOW
SYSTemCOMMunicateSERIalCOM2ANDATA
SYSTemCOMMunicateSERIalCOM2ANSTOP
SYSTemCOMMunicateSERIalCOM2APARIty
SYSTemCOMMunicateSERIalCOM2APROMpt
SYSTemCOMMunicateSERIalCOM2ARATE
SYSTemCOMMunicateSERIalCOM2ATXTERM
SYSTemCONFigMODuleSERIAL
SYSTemCOMMunicateSERIalCOM2ARTS
SYSTemCOMMunicateSERIalCOM2ARXTERM
SYSTemCONFigSLOTs
SYSTemCONFigMODuleTYPE
SYSTemCONFigMODuleVARIANT
SYSTemCONFigMODuleVERSion
SYSTemFILEsMGMTRESUltsDESTination
SYSTemERRor
SYSTemFILEsMGMTRESUltsAGE
SYSTemFILEsMGMTRESUltsCOUNt
SYSTemFILEsMGMTRESUltsENABle
SYSTemFILEsMGMTRESUltsINTErval
SYSTemFILEsMGMTRESUltsPERcent
SYSTemHEADers
SYSTemFILEsMGMTRESUltsSORT
SYSTemFILEsMGMTRESUltsTOTAlsize
SYSTemFORMatBLOCk
SYSTemLOCKREQuest
SYSTemSIGNalSTANdard
SYSTemLOCKRELease
SYSTemLOCKRELeaseFORCE
TST
SYSTemVERBose
Reference Remote Commands ~ Command Description
Weight
Environmental Specifications
Temperature Ranges
Dimensions
Clock Source
Transmitter Specifications
Signal Generation
Internal Mode
Through Mode
Table A-2 SDH Default Overhead Regenerator
Multiplexer
Background Channel
Internal Payload Structures
Test Patterns
Active Channel
Error Injection
Overhead Manipulation Specifications
Table A-3 Error Rate Max/Min
Defect/ Alarm Generation
Receiver Analyzer Specifications
Alarms Detection
Measurements
Overhead Display
OTS91L7, OTS91L8 Signal Name 9.95238 Gb/s Optical Input
Transmitter Input and Output Specifications
Specifications
Event Trigger Output
Frame Sync Output
GHz Clock Input
MHz Trigger Output
External 155.52 MHz Clock Input
Transmitter Data Output Electrical
GHz Clock Output
RX Clock Input
Receiver Input and Output Specifications
RX Clock Output
RX Data Input
Signal Name Rx Data Out / 10GHz/s Data
Module Interconnect Specifications
Signal Name Tx Data Out / Tx Data
Signal Name Rx Data Out / Rx Data
EMC Compliance Directive
Laser Safety
Certifications and Compliance
CE Mark Compliance
Optical OUT
Optical Card Front Panel Descriptions
Laser Lockout, Remote Interlock
Tx Data
Rx Data OUT
Optical
10 Gb/s TRANSMIT-ONLY Optics Card L5-15, L5-13
Tx Data
Module OK
10Gb/s Optical RECEIVE-ONLY L6
External Laser L7
10Gb/s Optical Transceiver Interface
External Laser
Figure B-5 shows the Optical Transmitter card front panel
10Gb/s Opticaltransmit ONLY/ External Laser L8
External Laser
Emergency Startup Disk
Accessing Help Files
Emergency Startup Disk
List of Acronyms
List of Acronyms
Tektronix Part Number Description
Module Card Replacement
Module Card Replacement
Installing the Software
Installing the Software
Illustrations of cabled OTS9100 module
Appendix
Cabling OTS9100 Module to OTS9261 Tunable Laser
Index
Index
Index-3
Index-4