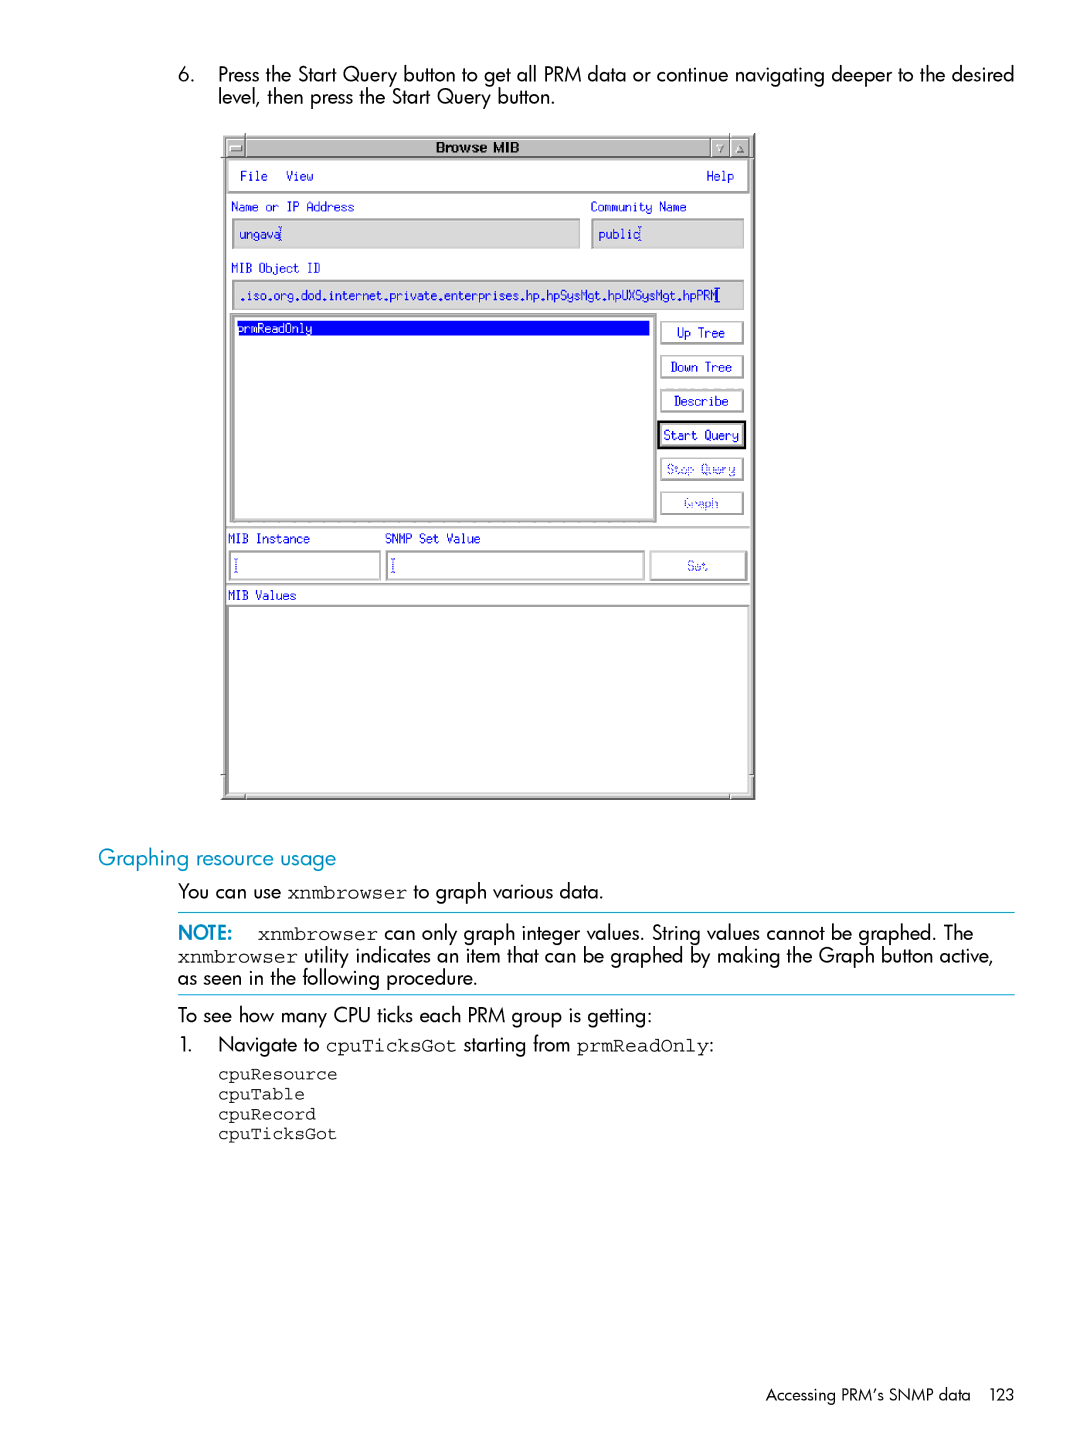
6.Press the Start Query button to get all PRM data or continue navigating deeper to the desired level, then press the Start Query button.
Graphing resource usage
You can use xnmbrowser to graph various data.
NOTE: xnmbrowser can only graph integer values. String values cannot be graphed. The xnmbrowser utility indicates an item that can be graphed by making the Graph button active, as seen in the following procedure.
To see how many CPU ticks each PRM group is getting:
1.Navigate to cpuTicksGot starting from prmReadOnly:
cpuResource cpuTable cpuRecord cpuTicksGot
Accessing PRM’s SNMP data 123