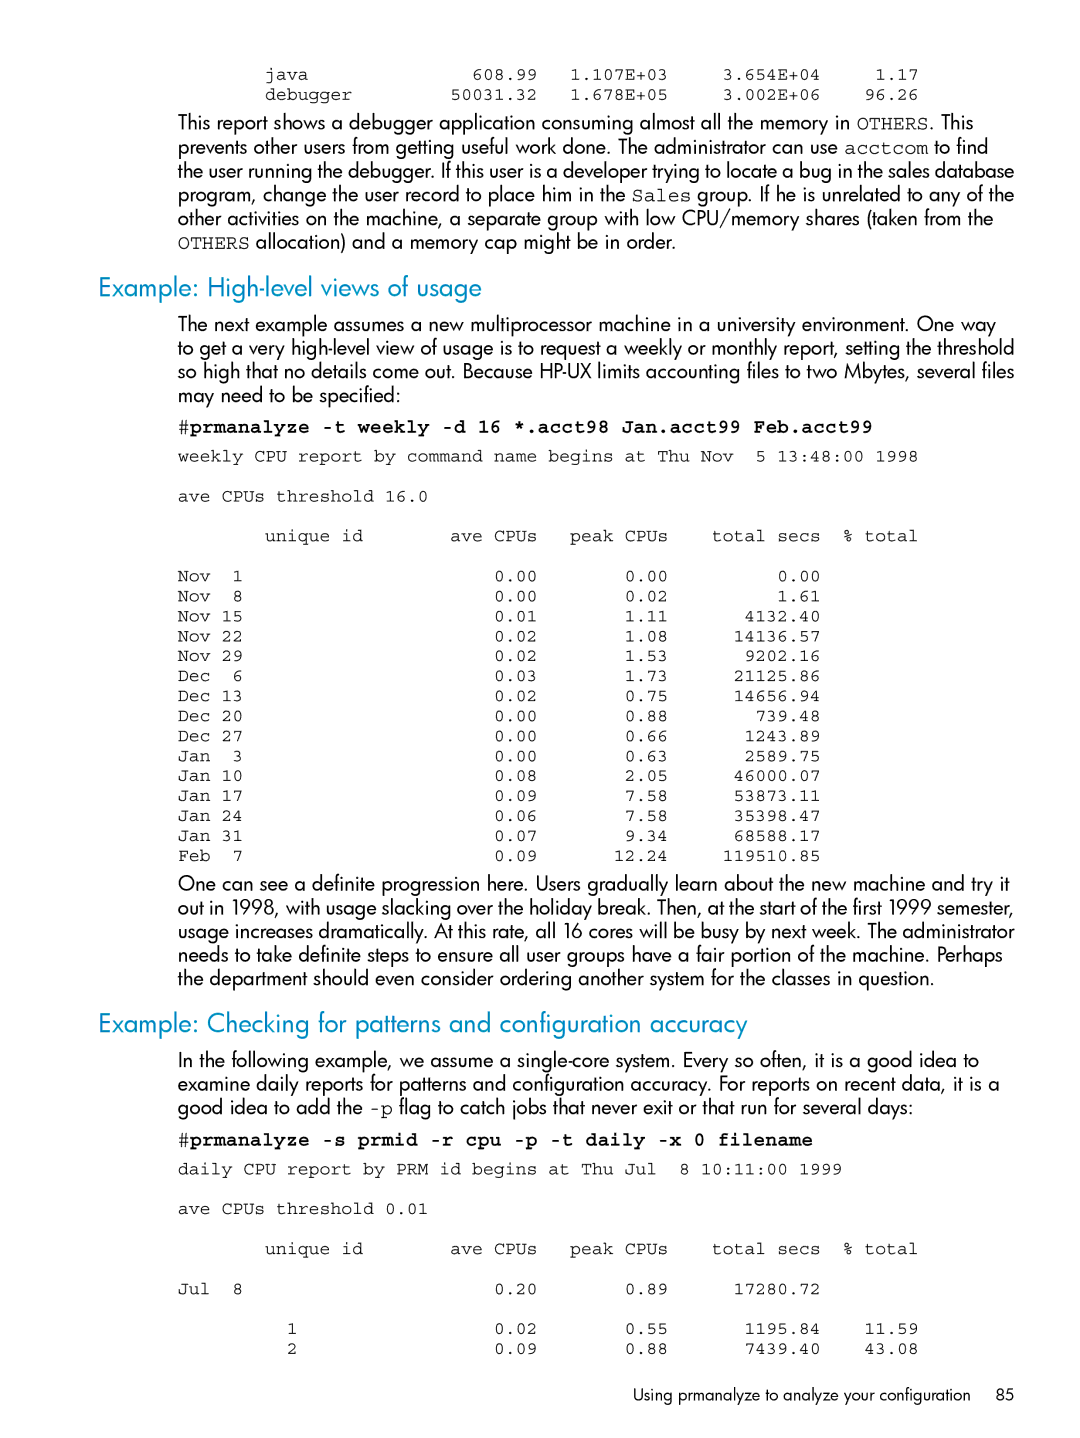
java | 608.99 | 1.107E+03 | 3.654E+04 | 1.17 |
debugger | 50031.32 | 1.678E+05 | 3.002E+06 | 96.26 |
This report shows a debugger application consuming almost all the memory in OTHERS. This prevents other users from getting useful work done. The administrator can use acctcom to find the user running the debugger. If this user is a developer trying to locate a bug in the sales database program, change the user record to place him in the Sales group. If he is unrelated to any of the other activities on the machine, a separate group with low CPU/memory shares (taken from the OTHERS allocation) and a memory cap might be in order.
Example: High-level views of usage
The next example assumes a new multiprocessor machine in a university environment. One way to get a very
#prmanalyze -t weekly -d 16 *.acct98 Jan.acct99 Feb.acct99
weekly CPU report by command name begins at Thu Nov 5 13:48:00 1998
ave CPUs threshold 16.0
| unique id | ave CPUs | peak CPUs | total secs % total |
Nov | 1 | 0.00 | 0.00 | 0.00 |
Nov | 8 | 0.00 | 0.02 | 1.61 |
Nov 15 | 0.01 | 1.11 | 4132.40 | |
Nov 22 | 0.02 | 1.08 | 14136.57 | |
Nov 29 | 0.02 | 1.53 | 9202.16 | |
Dec | 6 | 0.03 | 1.73 | 21125.86 |
Dec 13 | 0.02 | 0.75 | 14656.94 | |
Dec 20 | 0.00 | 0.88 | 739.48 | |
Dec 27 | 0.00 | 0.66 | 1243.89 | |
Jan | 3 | 0.00 | 0.63 | 2589.75 |
Jan 10 | 0.08 | 2.05 | 46000.07 | |
Jan 17 | 0.09 | 7.58 | 53873.11 | |
Jan 24 | 0.06 | 7.58 | 35398.47 | |
Jan 31 | 0.07 | 9.34 | 68588.17 | |
Feb | 7 | 0.09 | 12.24 | 119510.85 |
One can see a definite progression here. Users gradually learn about the new machine and try it out in 1998, with usage slacking over the holiday break. Then, at the start of the first 1999 semester, usage increases dramatically. At this rate, all 16 cores will be busy by next week. The administrator needs to take definite steps to ensure all user groups have a fair portion of the machine. Perhaps the department should even consider ordering another system for the classes in question.
Example: Checking for patterns and configuration accuracy
In the following example, we assume a
#prmanalyze -s prmid -r cpu -p -t daily -x 0 filename
daily CPU report by PRM id begins at Thu Jul 8 10:11:00 1999
ave | CPUs threshold 0.01 |
|
|
|
|
| unique id | ave CPUs | peak CPUs | total secs | % total |
Jul | 8 | 0.20 | 0.89 | 17280.72 |
|
| 1 | 0.02 | 0.55 | 1195.84 | 11.59 |
| 2 | 0.09 | 0.88 | 7439.40 | 43.08 |
Using prmanalyze to analyze your configuration 85