PRM gives
PRM itself has low system overhead.
Example: PRM CPU resource management
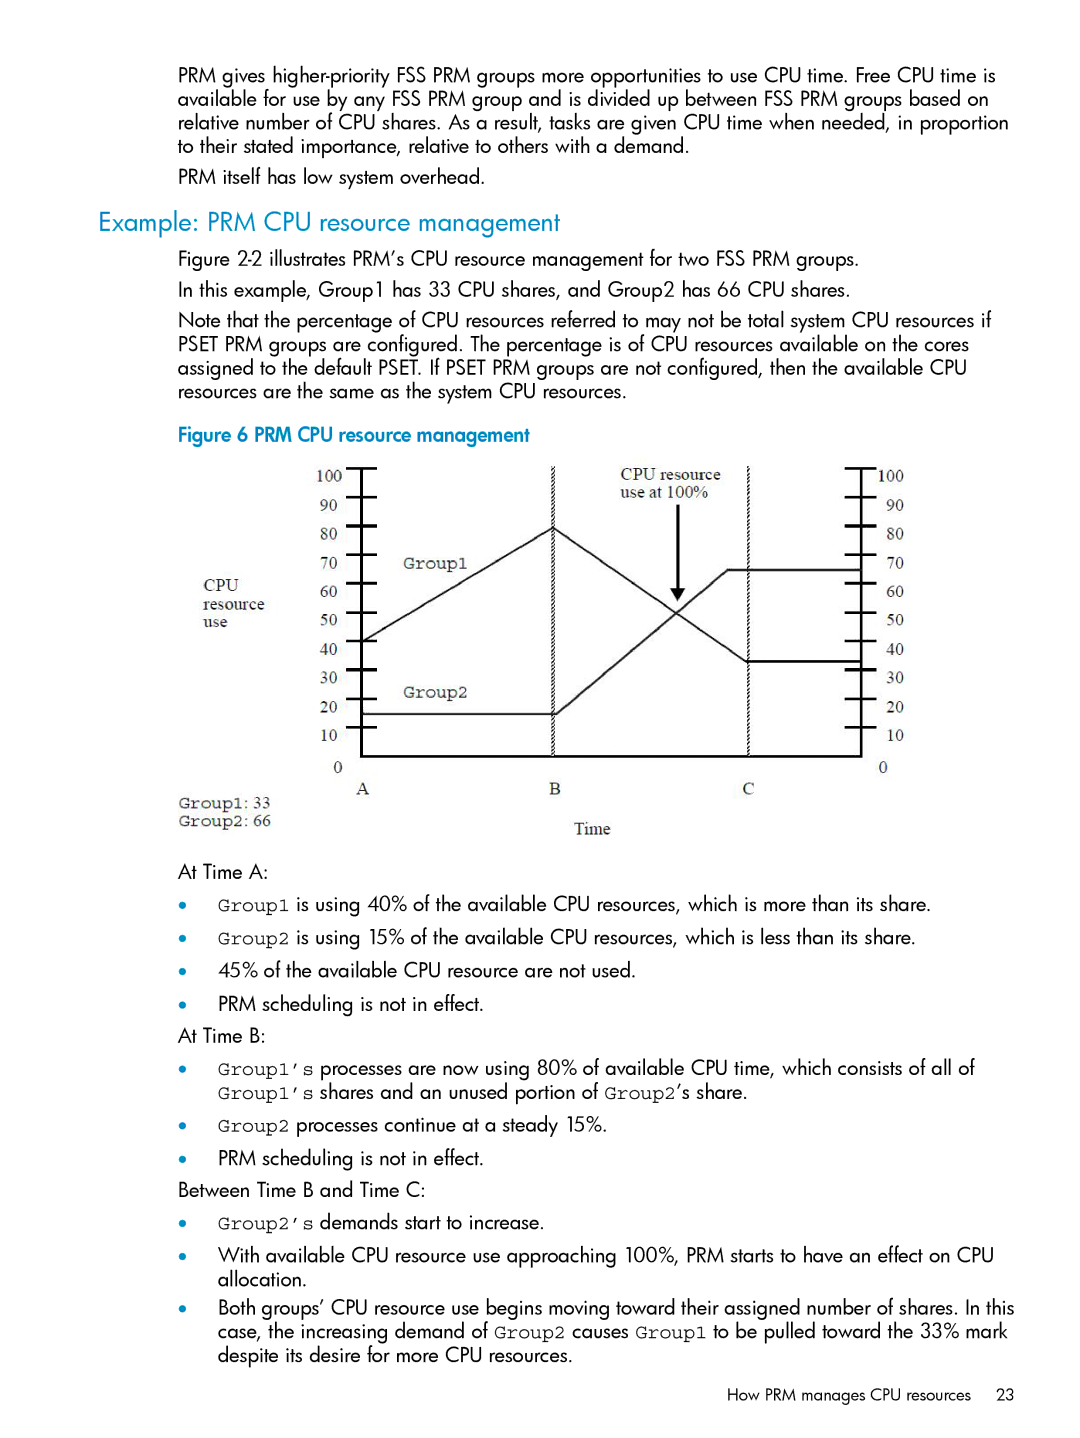
Figure 2-2 illustrates PRM’s CPU resource management for two FSS PRM groups.
In this example, Group1 has 33 CPU shares, and Group2 has 66 CPU shares.
Note that the percentage of CPU resources referred to may not be total system CPU resources if PSET PRM groups are configured. The percentage is of CPU resources available on the cores assigned to the default PSET. If PSET PRM groups are not configured, then the available CPU resources are the same as the system CPU resources.
Figure 6 PRM CPU resource management
At Time A:
•Group1 is using 40% of the available CPU resources, which is more than its share.
•Group2 is using 15% of the available CPU resources, which is less than its share.
•45% of the available CPU resource are not used.
•PRM scheduling is not in effect.
At Time B:
•Group1’s processes are now using 80% of available CPU time, which consists of all of Group1’s shares and an unused portion of Group2’s share.
•Group2 processes continue at a steady 15%.
•PRM scheduling is not in effect.
Between Time B and Time C:
•Group2’s demands start to increase.
•With available CPU resource use approaching 100%, PRM starts to have an effect on CPU allocation.
•Both groups’ CPU resource use begins moving toward their assigned number of shares. In this case, the increasing demand of Group2 causes Group1 to be pulled toward the 33% mark despite its desire for more CPU resources.
How PRM manages CPU resources 23
