NOTE: GlancePlus does not correctly track the PRM ID at the process level for
Also, GlancePlus returns incorrect data for the PRM_SYS group for PRM configurations with processor sets defined. Use the prmmonitor command instead of GlancePlus if you are using PSET PRM groups.
1.Load the PRM configuration you want to analyze with prmconfig
2.Compare the PRM resource shares against the reported usage in GlancePlus during peak activity. Select the PRM Group List under the Reports menu to see the active processes, users, and their resource use. Determine if you need to adjust the shares or move users or processes to different groups.
3.Change your PRM configuration based on your review of the GlancePlus data.
4.Load the changed PRM configuration with prmconfig
5.Repeat Step 2, Step 3, and Step 4 as needed.
For information on using GlancePlus, see the GlancePlus online help.
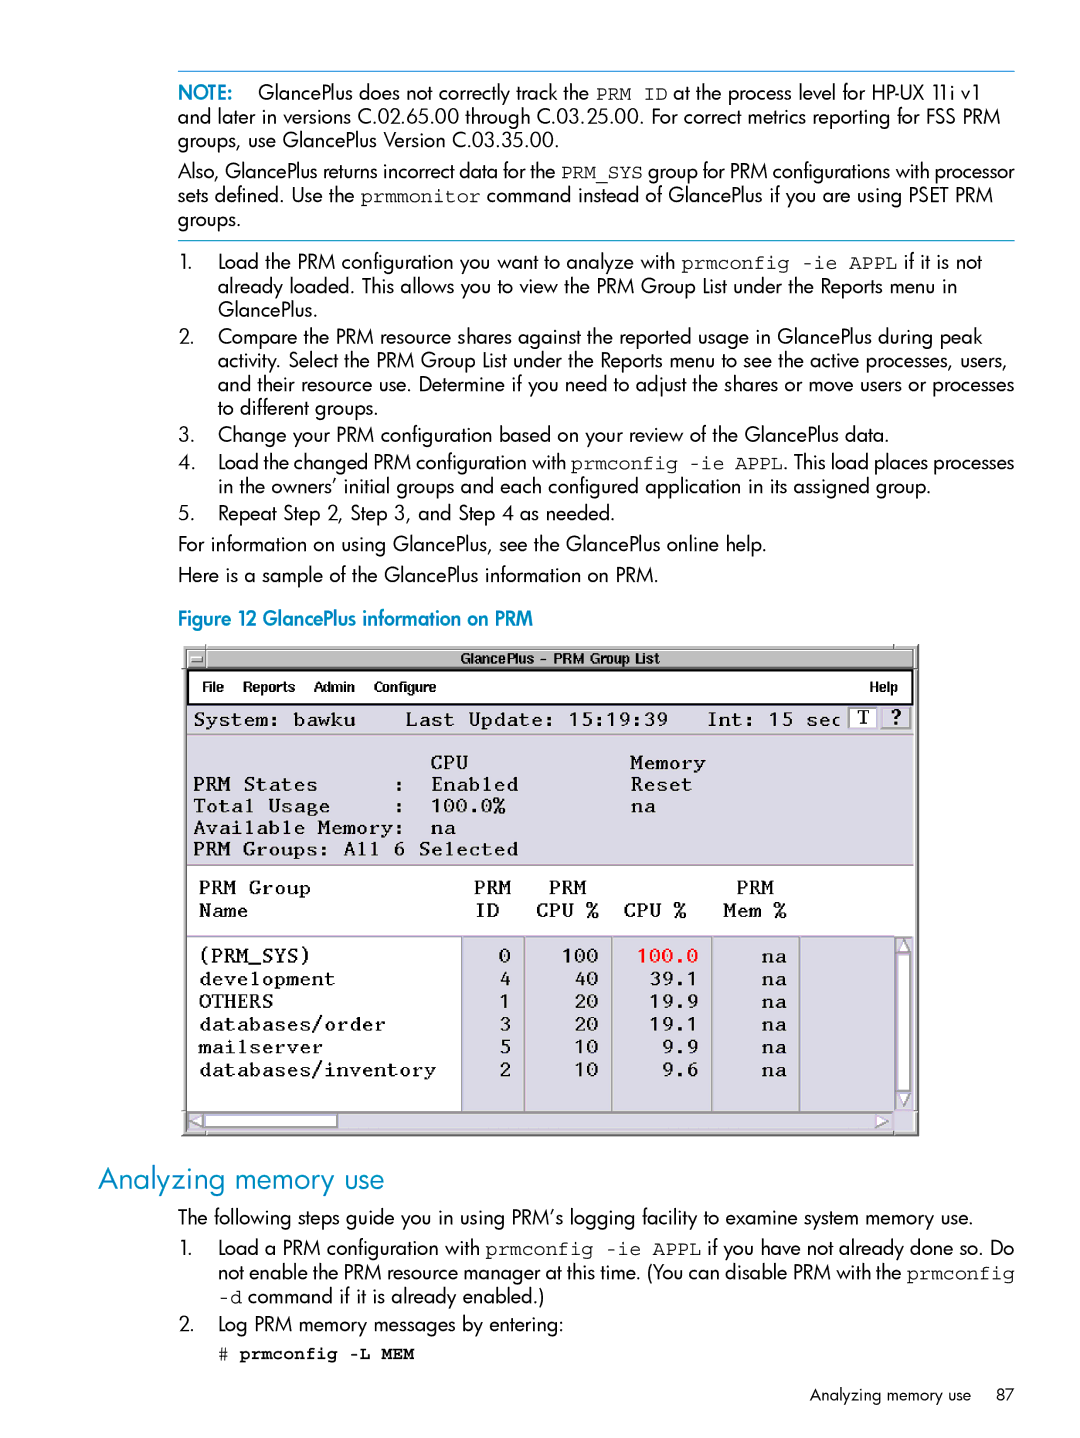
Here is a sample of the GlancePlus information on PRM.
Figure 12 GlancePlus information on PRM
Analyzing memory use
The following steps guide you in using PRM’s logging facility to examine system memory use.
1.Load a PRM configuration with prmconfig
2.Log PRM memory messages by entering:
# prmconfig
Analyzing memory use 87