decreases if prm2d is running, because PRM reserves 11% of the remaining memory to ensure the processes in PRM_SYS have immediate access to needed memory.
This command is useful in determining memory shares. For example, if a PRM group receives 50 of the 100 memory shares assigned, the number of shares equates to 106 Mbytes on this system. If that is too much or too little memory, the number of shares can be adjusted accordingly.
Displaying number of cores to determine number of shares
The prmavail command displays the number of cores when the CPU argument is specified:
#prmavail CPU 16 Cores
This command is useful in determining how much CPU resources a number of shares equates to on a multiprocessor system. For example, 25 CPU shares out of a total of 100 shares assigned on a
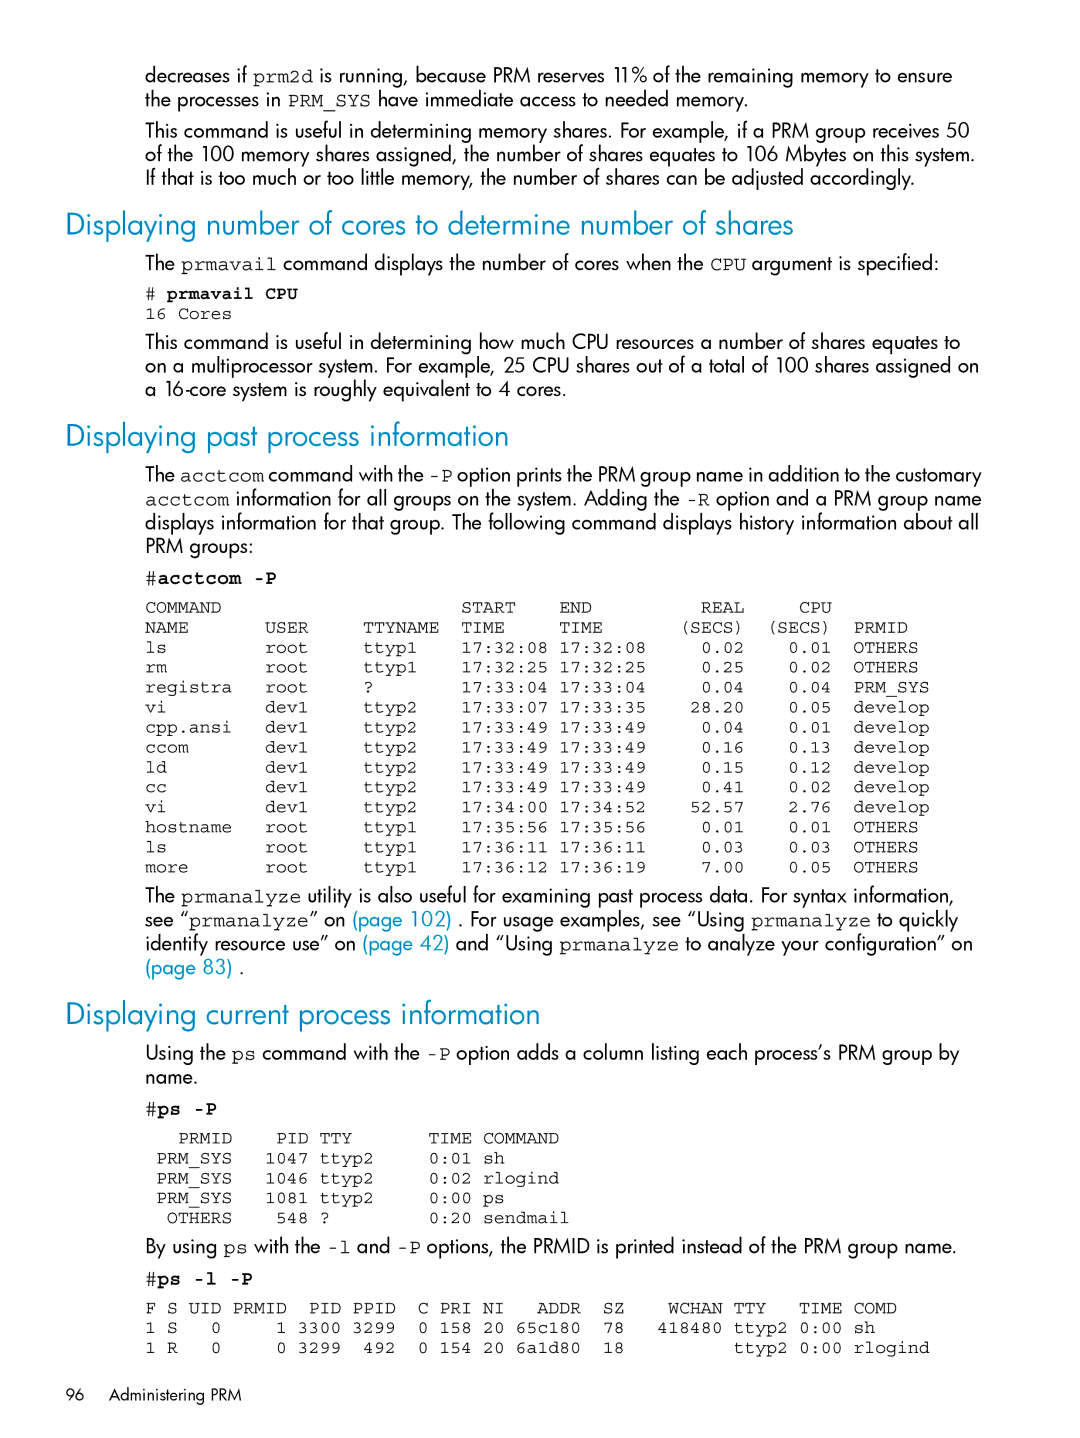
Displaying past process information
The acctcom command with the
#acctcom -P
COMMAND |
|
| START | END | REAL | CPU |
|
NAME | USER | TTYNAME | TIME | TIME | (SECS) | (SECS) | PRMID |
ls | root | ttyp1 | 17:32:08 | 17:32:08 | 0.02 | 0.01 | OTHERS |
rm | root | ttyp1 | 17:32:25 | 17:32:25 | 0.25 | 0.02 | OTHERS |
registra | root | ? | 17:33:04 | 17:33:04 | 0.04 | 0.04 | PRM_SYS |
vi | dev1 | ttyp2 | 17:33:07 | 17:33:35 | 28.20 | 0.05 | develop |
cpp.ansi | dev1 | ttyp2 | 17:33:49 | 17:33:49 | 0.04 | 0.01 | develop |
ccom | dev1 | ttyp2 | 17:33:49 | 17:33:49 | 0.16 | 0.13 | develop |
ld | dev1 | ttyp2 | 17:33:49 | 17:33:49 | 0.15 | 0.12 | develop |
cc | dev1 | ttyp2 | 17:33:49 | 17:33:49 | 0.41 | 0.02 | develop |
vi | dev1 | ttyp2 | 17:34:00 | 17:34:52 | 52.57 | 2.76 | develop |
hostname | root | ttyp1 | 17:35:56 | 17:35:56 | 0.01 | 0.01 | OTHERS |
ls | root | ttyp1 | 17:36:11 | 17:36:11 | 0.03 | 0.03 | OTHERS |
more | root | ttyp1 | 17:36:12 | 17:36:19 | 7.00 | 0.05 | OTHERS |
The prmanalyze utility is also useful for examining past process data. For syntax information, see “prmanalyze” on (page 102) . For usage examples, see “Using prmanalyze to quickly identify resource use” on (page 42) and “Using prmanalyze to analyze your configuration” on (page 83) .
Displaying current process information
Using the ps command with the
#ps -P
PRMID | PID | TTY | TIME COMMAND | |
PRM_SYS | 1047 | ttyp2 | 0:01 sh | |
PRM_SYS | 1046 | ttyp2 | 0:02 rlogind | |
PRM_SYS | 1081 | ttyp2 | 0:00 | ps |
OTHERS | 548 | ? | 0:20 | sendmail |
By using ps with the
#ps -l -P
F S UID PRMID | PID PPID | C PRI NI | ADDR | SZ | WCHAN | TTY | TIME COMD | |||||
1 | S | 0 | 1 | 3300 | 3299 | 0 158 20 | 65c180 | 78 | 418480 | ttyp2 | 0:00 | sh |
1 | R | 0 | 0 | 3299 | 492 | 0 154 20 | 6a1d80 | 18 |
| ttyp2 | 0:00 | rlogind |
96 Administering PRM