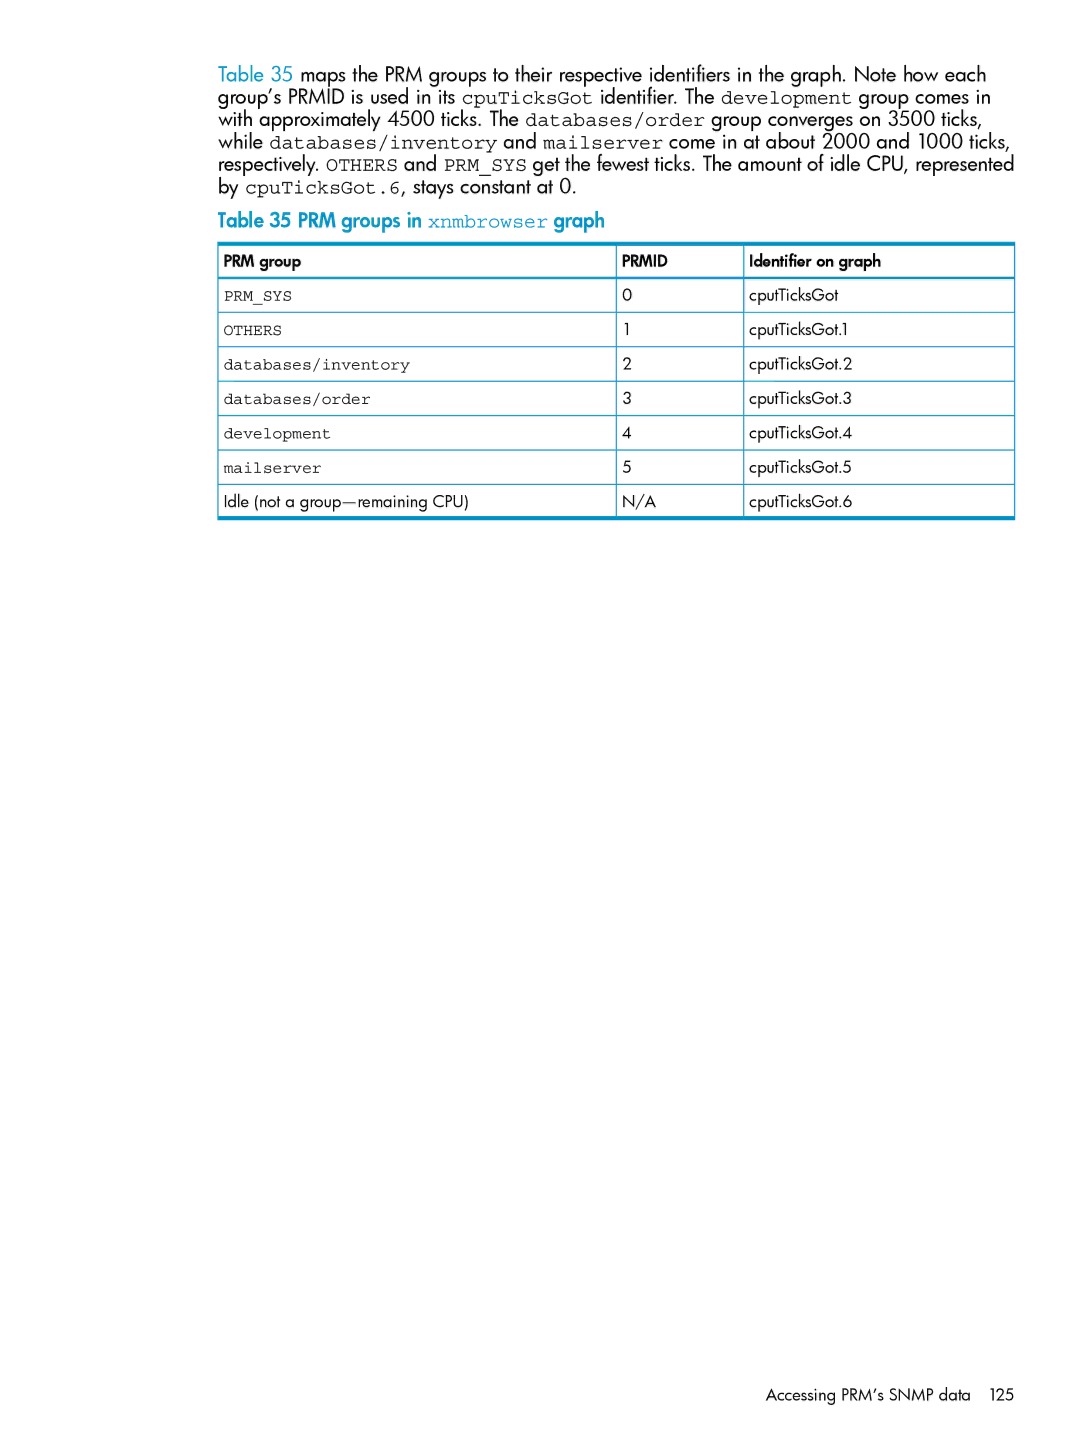
Table 35 maps the PRM groups to their respective identifiers in the graph. Note how each group’s PRMID is used in its cpuTicksGot identifier. The development group comes in with approximately 4500 ticks. The databases/order group converges on 3500 ticks, while databases/inventory and mailserver come in at about 2000 and 1000 ticks, respectively. OTHERS and PRM_SYS get the fewest ticks. The amount of idle CPU, represented by cpuTicksGot.6, stays constant at 0.
Table 35 PRM groups in xnmbrowser graph
PRM group | PRMID | Identifier on graph |
PRM_SYS | 0 | cputTicksGot |
OTHERS | 1 | cputTicksGot.1 |
databases/inventory | 2 | cputTicksGot.2 |
databases/order | 3 | cputTicksGot.3 |
development | 4 | cputTicksGot.4 |
mailserver | 5 | cputTicksGot.5 |
Idle (not a | N/A | cputTicksGot.6 |
Accessing PRM’s SNMP data 125
