The command to generate these reports: [LINEBREAK]prmanalyze
daily weekly monthly}
•Conflict
This report provides the most detail, highlighting only the instances where resources are scarce and users are in conflict.
Use this report when
The command to generate this report: prmanalyze
This section focuses on certain prmanalyze functionality. Command options are used, but not described, in this section. For syntax information, see the section “prmanalyze ” (page 102).
NOTE: The examples below are for illustrative purposes only. They are not from an actual machine. The “summary report” is omitted from the examples below to better focus on the other reports.
The examples assume you have an existing PRM configuration that you want to improve. The prmanalyze utility can also be used to create an initial PRM configuration, as shown in “Using prmanalyze to quickly identify resource use” on (page 42) .
NOTE: To use prmanalyze, you must have already collected UNIX accounting data in a file (/var/adm/pacct by default) using accton filename.
Example: Locating system bottlenecks
The first example shows how one might locate system bottlenecks and
Many of the interactive users assigned to the group OTHERS have complained that the system response time is terrible in the afternoons. The administrator examines the summary reports generated by prmanalyze, but sees nothing out of the ordinary. The administrator then looks more closely at CPU resource use:
#prmanalyze -r cpu -1 -t hourly -s prmid myacct
The CPU hourly report, however, is normal. The OTHERS group is getting plenty of CPU resources at all times. It has shares equaling 25%, but never demands more than 15%. So CPU resources are not the problem. Next, examine memory:
#prmanalyze -r mem -E -1 -t hourly -s prmid myacct
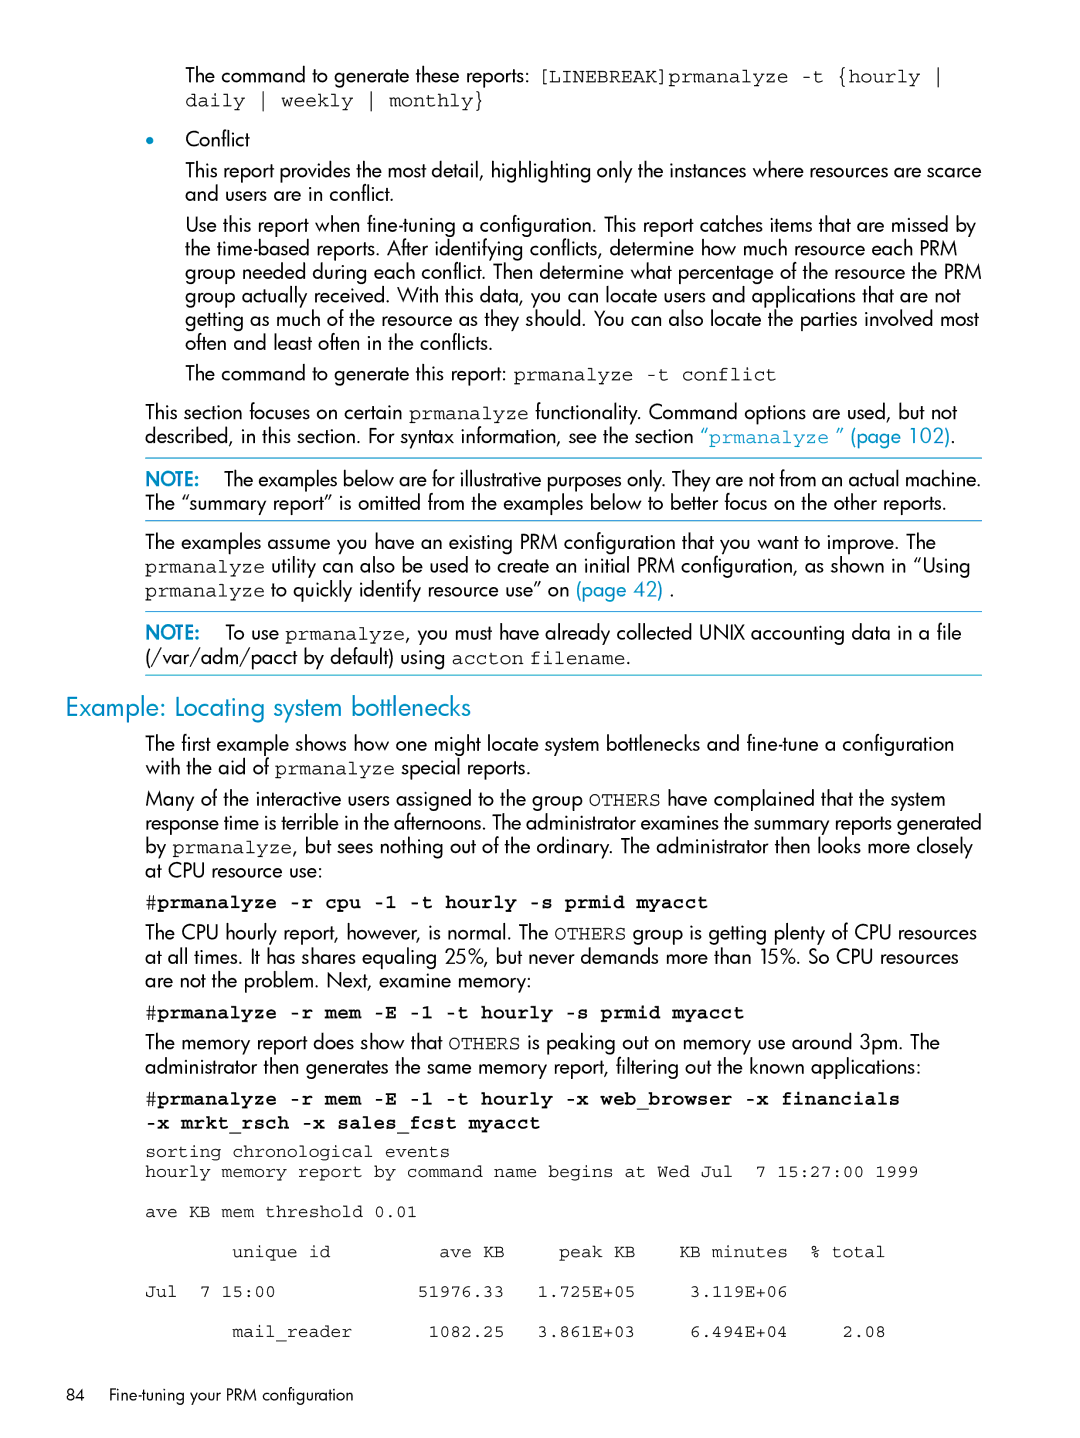
The memory report does show that OTHERS is peaking out on memory use around 3pm. The administrator then generates the same memory report, filtering out the known applications:
#prmanalyze
sorting chronological events
hourly memory report by command name begins at Wed Jul 7 15:27:00 1999
ave KB mem threshold 0.01
unique id | ave KB | peak KB | KB minutes | % total |
Jul 7 15:00 | 51976.33 | 1.725E+05 | 3.119E+06 |
|
mail_reader | 1082.25 | 3.861E+03 | 6.494E+04 | 2.08 |
84
