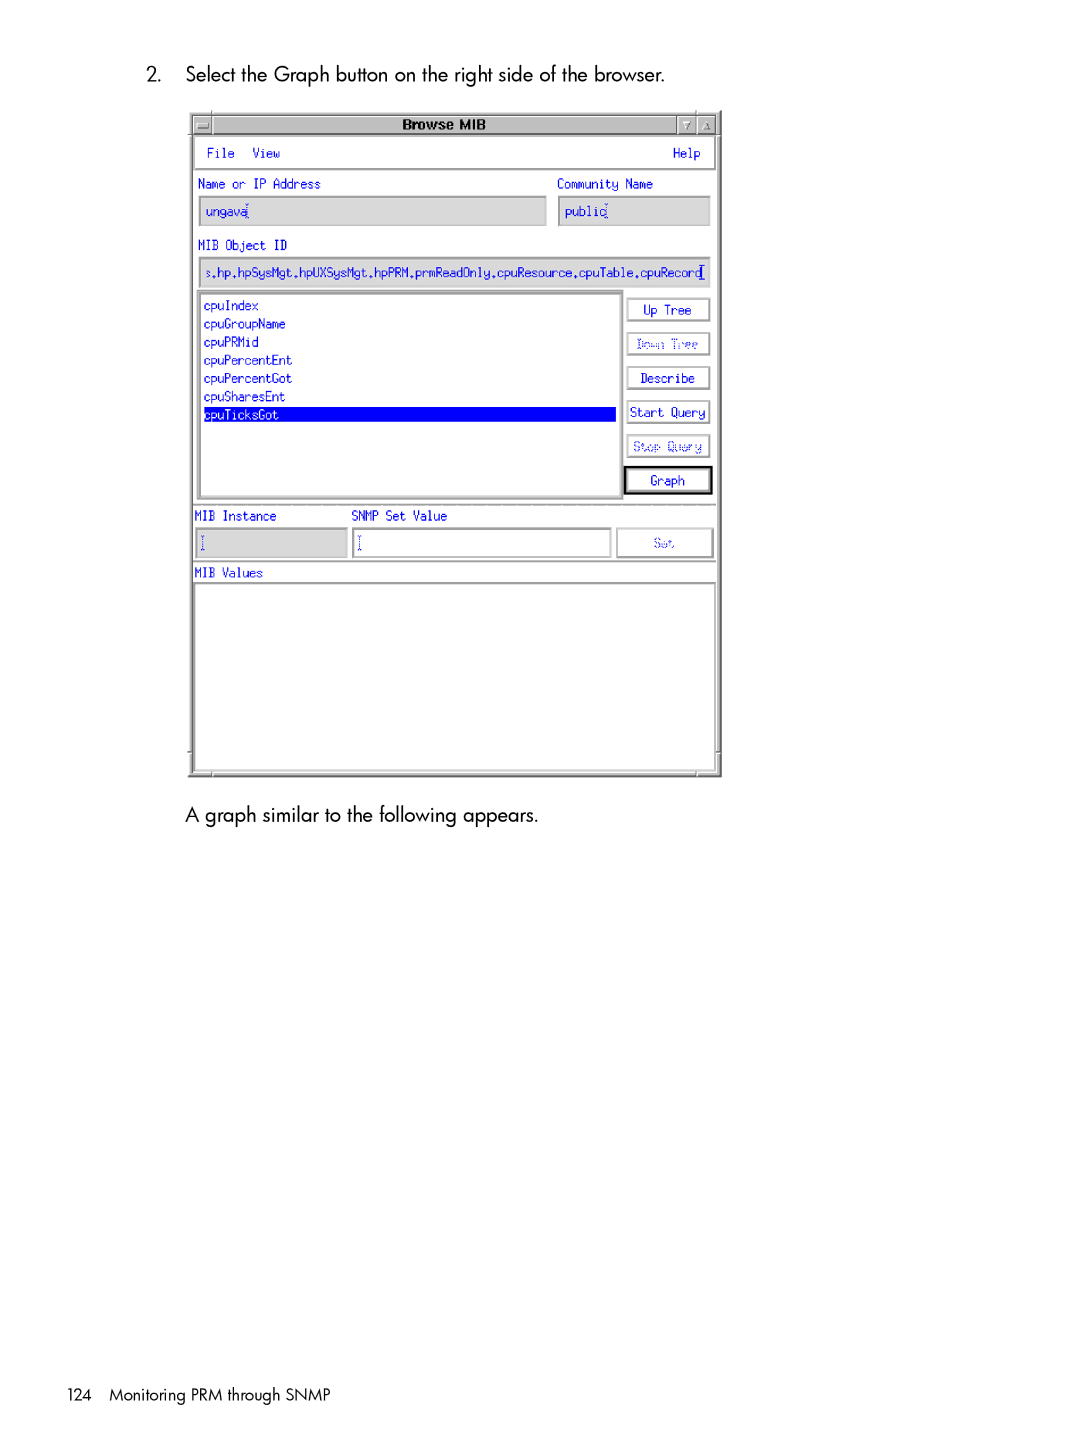
2.Select the Graph button on the right side of the browser.
A graph similar to the following appears.