Page
Page
Page
Trademark Acknowledgements
Table of Contents
Creating Lines And Graphics
Table of Contents
CPI
Barcodes
Industrial Graphics Application
PGL Menu Operations
201
Postnet
MSI
UPC-A
UPC-E
Ascii Chart
Block-Character Size Tables
Table of Contents
QMS Code V Graphics Processing Language
Turning Graphics Mode On
Graphics Mode
Graphics Processing Language
Graphics Processing Language
Turning Graphics Mode Off
PY Then
PY Then
Using ESC Sequences
Code V Command Character Cvcc
Changing The Cvcc
Through The Control Panel
Turning Free Format On
Free Format
Turning Free Format OFF
Turning Free Format On
Control Code Equivalents
Free Format
Control Code Equivalents Hex
Graphics Pass
Ignore Data
SUB
ESC
Pass Spacing Modplot
Pass Buffer Length
Graphics Pass
Pass Format
Vertical Right Orientation
Pass Format
Vertical Left Orientation E
GPL Commands
Multiple Passes
Multiple Passes
GPL Commands
Character Printing
Control Panel Option
Block Character
Block Character
Page
Option
Graphics
Page
Descender Mode
Descender Mode
Revese Image Descender Mode
Revese Image Descender Mode
Reverse Image
Half-Tone
Half-Tone
DOT Pattern
Half-Tone Toggle
Half-Tone Reverse Image
Half-Tone Toggle
Half-Dot Mode And Half-Tones
Half-Dot Mode Double Density
Half-Dot Mode Double Density
Half
Block Character Fonts
CPI
CPI
Block Character Fonts
10 CPI
12 CPI
15 CPI
12 CPI
Code V Font Selection
Code V Character Set Selection
Code V Font Selection
15 CPI
Compressed Fonts
NLQ Fonts
NLQ Fonts
IFONT,S
Default Font Selection
Full Space Font Mode
High Quality Font Mode
Draft Fonts
Font/Quality Speed
Hex Command
Dump Mode
Half Space Font Mode
Half Space Font Mode
Block Character
ISO Character Sets
Control Panel Option
Iiso
ISO Character Set Table
ISO Character Set Table
Creating Lines Graphics
Line Drawing
Solid Lines
Line Drawing
Dashed Lines
Dashed Lines
Line Drawing
Boxes
Boxes
Form Drawing
Form Drawing
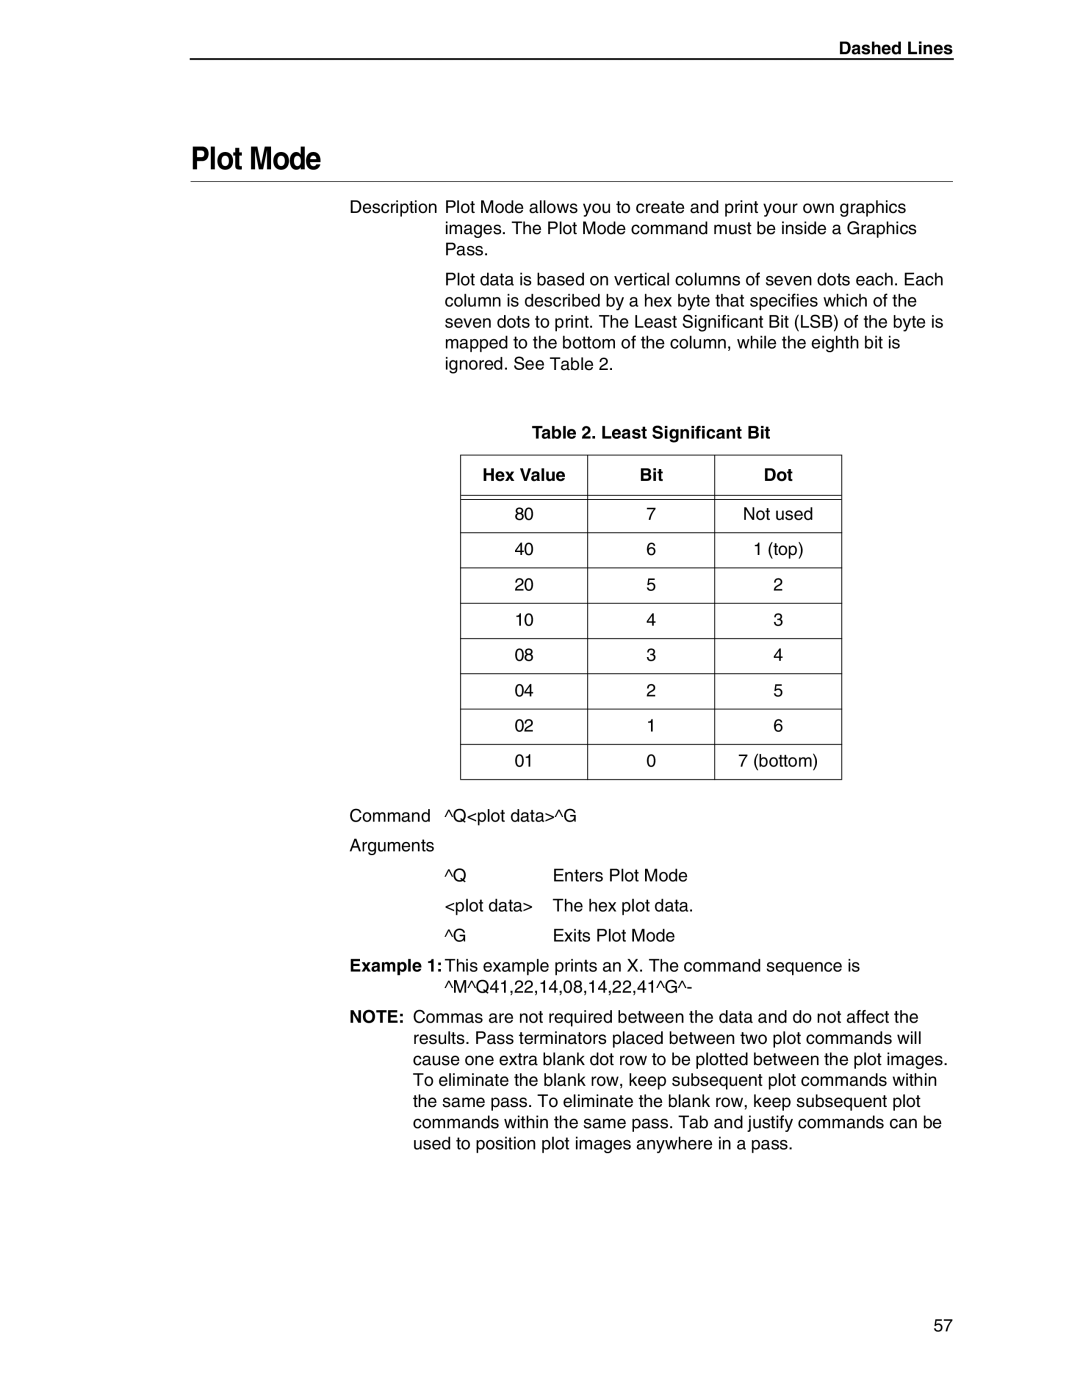
Least Significant Bit Hex Value Dot
Plot Mode
Version 1 Logos
Logos
Version 2 logos
Pixel Expansion
Version 2 logos
Ilogo
Pixel Expansion
UPC a UPC E EAN
Barcodes
Barcode Density
Selecting Barcodes
Barcode Height
Barcode Width
Barcode Version
Barcode Version
Ibarc
Embarc
Aiag
Hibcc
Logmar
Chapter
Barcode Version
Sets the barcode style to EAN
IFONT,S,1G
First Command M0505000IFONT,S,1GIBARC,C128,B,HorizontalG
Dark/Light Bar Ratios
Fourth Command V0505000T0250IBARC,C128,B,Vert RightG
High Density Barcode
High Density Barcode
Code 128 Barcode
Logmars Barcode
Code 128 Barcode
DEL FNC3 FNC2
Barcode Commands What a scanner will read
FNC4
FNC1
Code 128 Special Characters
Code 128 Special Characters
Code 128 Translation Table Code a Code B Code C Value
Chapter
NUL SOH STX ETX EOT ENQ ACK BEL DLE
FNC Code a
Code B FUNC-4
Accessing Postnet in Cvcc
Accessing Postnet in Cvcc
Postnet Barcodes
Orientation
Parameters In Postnet
Aiag Barcodes
Postnet Barcodes
Hibcc Barcode
Embarc Barcodes
Hibcc Barcode
Postnet Barcodes
Positioning and Repeating
Positioning Data
Horizontal Tab
Positioning Data
Vertical Justification
Pass Height
Pass Height
Phic
Pass Density
Pass Width
Dot Slew
Form Length
Dot Slew
Interrupt Function
Repeating Data, Version
Repeating Data
Horizontal Repeat, Version
Horizontal Repeat, Version
Mode
Repeating Data, Version
Vertical Repeat, Version
Vertical Repeat, Version
Irepv
Multiple Repeat Commands
Multiple Repeat Commands
Automatic Increment/Decrement
Automatic Increment/Decrement
Multiple Repeat Commands
AA8
Multiple Repeat Commands
Vertical Repeat
Horizontal Repeat
Buffered/Defined Forms
Buffered Forms
Data Fields
Buffered Form Create
Buffered Form Execute
Buffered Forms
Control Code Command Changes
Control Code Command Changes
IFORM,ETEST 1GABCDEF-G
IFORM,EEXAMPLE 1G
IFORM,EAIGG
Buffered Form Reset
Buffered Form Delete
IFORM,D
Buffered Form List
Buffered Form List
Buffered Form Copy
Buffered Form Repeats
IFORM,EEXAMPLE1G
Buffered Form Copy
Repeat
Predefined Forms
Aiag Forms
Aiag Forms
Quantity
Partner Number
Supplier Quantity
Serial Number
Primary Metals Form
Primary Metals Form
Theoretical Weight/Length
Actual Weight
Product Identification
Supplier Number
IFORM,EMETALSF.MTG
Supplier Address
STICK+
GUM+
MINT+
TASTE+
GREEN+
115
Version 1 Buffered Formatting
Version 1 Buffered Formatting
Control Code Command Changes
Version 1 Buffered Formatting
Control Code Command Changes
120
Introduction
Industrial Graphics Application
Invalid Commands
Entering Barcode/Block Mode
Control Sequences
Print Cycles
Exiting Barcode/Block Character Mode
Exiting Barcode/Block Character Mode
Control Sequence Formatting
Valid Control Sequences
Move The Home
Select Horizontal Barcode
Select Vertical Barcode
Select Double Density Block Characters
Valid Control Sequences
Select Normal Density Block Characters
Select New Introducer
Relative Cursor Move
Signed Cursor Move
Absolute Cursor Move
Set Unit Line
Set Barcode Density
Paper Motion Commands
Paper Motion Commands
Home And Cursor
Barcodes
Code 39 Types 1
Emulation Limitations
DLE DC1 DC2 DC3 DC4 NAK SYN ETB Can SUB ESC DEL
Code 39 Type 1 Examples
Code 39 Type 2 Examples
Code 39 Type 2 Examples
Two of Five with 21 Ratio Type
Interleaved Two of Five, 21 Type
Interleaved Two of Five, 21 Type
Two of Five with 31 Ratio Type
Interleaved Two of Five, 31 Type
Interleaved Two of Five, 31 Type
UPC Version a Type
EAN-13 Type
EAN-13 Type
EAN-8 Type
Block Character Sizes
Block Characters
Normal Density M Examples
Block Character Sizes
Block Characters
Other Size Variations
Double Density D Examples
Double Density D Examples
Mixing Barcode/Block Characters
Command Summary Table
Command Summary
Mixing Barcode/Block Characters
Command Summary Table
PGL Menu Parameters
PGL Menu Operations
Graphic Menu Category
Configurations Menu Entries For Graphics Options Applicable
Graphic Menu Category
Menu Level Graphic Option Category
Smooth Parameter
PGL Graphic Parameters
Darkbar Parameter
Smooth Parameter
Zero Parameter
Vscale Parameter
Sfcc Parameter
PGL Graphic Parameters
PGL Command Set Standards
PGL Command Set
PGL Command Set Standards
Command Parameters
Printable Data Delimiter
Spaces
Comments
Numeric Variables
Print Position Location
Numeric Variables
Double-Density Printing Dark Parameter
Data Types
Supported PGL Commands
PGL Commands
PGL Modes
PGL Modes
PGL Commands Supported PGL Commands
LPI Normal Quiet Reset Reverse Scale Sfcc Sfoff Sfon Uset
Igoff Igon Iset Lform Listen
Command Presentation Supported PGL Commands
Command Presentation
Table Key
Vdup Vert
Alphanumeric String Creation Commands Create
PGL Commands
Alpha
DPI
Stop
Incremented Static Fixed Alphanumeric Strings
Incremented Static Fixed Alphanumeric Strings
Stepmask
Startdata Incremented Field
Stepmask Increment Information Field
Any Other Character
Startdata
Startdata Incremented Field
Example Key
SM = Stepmask SD = Startdata
ZZ00Z
Startdata Incremented Field
Dynamic Incremented Alphanumeric Strings
Form Length Commands Create
Horizontal Duplication Command
Duplication Commands Create
Duplication Commands Create
Valid Ranges
Termines Horizontal duplication Enter Hdupoff Mode
Vertical Duplication Command
Vdup
Vdupoff
Using Duplication Commands
Using Duplication Commands
Number Command Create
Reverse Print Command Create
Reverse Print Command Create
Reverse Command Field Function Option/Modifier Selections
Enter Reverse
Execute Mode Normal
Exit Create Mode Create
Execute
Page
Stepmask
Stepmask
Box Command Create
Box Command Field Function Option/Modifier Selections
BOX
Stop
Using The Box Command
Using The Box Command
Call Logo Command Create
Call Logo Command Field Function Option/Modifier Selections
Initiates Create Logo mode Enter Logo
Change LPI Command Normal and Execute
Change LPI Command Normal and Execute
LPI
Change Sfcc Command Normal and Execute
PGL Commands Field
Change Sfcc Command Function Option/Modifier Selections
Corner Command Field Function Option/Modifier Selections
Create Corner Frames Create
Create Corner Frames Create
Stop
Using The Corner Command
Using The Corner Command
Create Form Command Normal
Create Logo Command Normal
Using The Create Form Command
Create Logo Command Normal
Logo
Using the Logo Command
Logo Plot
Delete Logo Command Normal
Delete Form Command Normal
Delete Form Command Normal
Delete Form Command Function Option/Modifier Selections
Directory Command Normal
Density Command Normal and Execute
Expanded Print Command Normal and Execute
Expanded Print Command Normal and Execute
Horizontal Line Command
Horizontal And Vertical Line Commands Create
Command Specifier Enter Vert
Vertical Line Command
Ignore Commands Normal, Create, and Execute
Ignore Commands Field Function Option/Modifier Selections
Igoff
Normal Command Normal and Execute Mode
PGL Mode Control
Quiet Command Normal
Listen Command Normal
Reset Command Normal and Execute
Listen Command
Reset Command Field Function Option/Modifier Selections
Scale Command Create
Scale Command Create
Character Scale Placement
DOT
Sfon
Select Format SF Command Normal, Create, and Execute
Practice
Select Format SF Command Normal, Create, and Execute
Practice
Sample Form Printout
Practice
Barcode Command Parameters
PGL Barcodes Used in Create Mode Only
PGL Barcodes
Name/CD
Vscan Vertical Scan
PGL Barcodes Used in Create Mode Only Enter Function
Hn Height Expansion
Magnification Value X-Factor
Dark Dark Printing
BFnL Dynamic Barcode Data Field
SR Staring Row
SC Starting Column
LOC Location of Human Readable Characters
= 10 CPI Ascii
OCR-B
Command Parameters VS Barcode Types
Command Parameters VS Barcode Types
Code 39 Data Field Characters
Data Field Characters
Data Field Characters
Code 39 Character Set HEX Value
Code 128B Character Set HEX Value
Code 128B and 128C Data Field Characters
Interleaved 2/5 I-2/5 Data Fields
Codes EAN 8 and EAn 13 Data Fields
MSI Data Fields
Data Field Characters Code 128B Character Set HEX Value
Incrementing Barcode Data
Code
PGL Barcode Commands And Output
Sample Create Code 39 Program
Code
PGL Barcode Commands And Output
Code 128B
Sample Create Code 128B Program
Code 128C
Sample Create Code 128C Program
Code 128C
Sample Create Code EAN 8 Program
EAN
EAN
Sample Create Code EAN 13 Program
EAN
Sample Create Interleaved 2/5 Program
Interleaved 2/5
Sample Create MSI Program
MSI
Postnet Samples
ZIP + 4 Program
Advaned Barcode Format
Sample Create Code Upca Program
UPC-A
Sample Create Code UPC-E Program
UPC-E
Barcode And LCP Printing
ESC P
Introduction
Ascii DC4
Syntax Parameters
Special Features
Special Features
Secured/Unsecured Mode
Secured/Unsecured Mode
Data Structure
Description
Special Features Example
Barcode Header
Barcode Printing
Header Format
Barcode Printing
Barcode Header
Transparent Barcode/LCP Commands
Barcode Types
Barcode Print Feature F for Selection of F-Code
Barcode Width
HRI
EAN/UPC Barcode
Error Code
Code 2/5 Matrix
Data Formats of Barcode Types
Syntax
Example
Data Formats of Barcode Types
Code 2/5 Industrial
Code 2/5 Interleaved
Code 2/5 Interleaved
Figures/Characters n Start Code Stop Code
Code BCD Matrix
Code BCD Matrix
Not fixed Recommended
Codabar
Figures n Check Start Code Separation Stop Code Number c
Code EAN 8 With HRI
Code EAN 8 Without HRI
Code EAN 8 Without HRI
Code EAN 13 With HRI
Code EAN 13 Without HRI
Code EAN 13 Without HRI
Code MSI/Modify Plessey
Code UPC a With HRI
Code UPC a With HRI
Code UPC a Without HRI
Code UPC E With HRI
Code UPC E With HRI
Code UPC E Without HRI
Code Delta Distance IBM
Code Delta Distance IBM
Hex None Dec
Special Characters Code
Data Formats of Barcode Types Wert Code a Code B Code C
Wert
FNC1
Code Wert Code a Code B Code C
256
Add-On Barcodes
Check Number Calculation
EAN
EAN
Upca
Add-On
US Postnet Barcode
LCP Header
Large Character Printing LCP
LCP Data
Large Character Printing LCP
LCP Character Set US-ASCII LCP Character Set German
US-ASCII Character Set
German Character Set
LCP Character Set US-ASCII LCP Character Set German
Example for Different LCP Character Sizes
Single line Feed 1/6
Customer Support
TallyGenicom Customer Support Center
TallyGenicom Supplies Department
Appendix a Corporate Offices
Corporate Offices
Ascii Chart
Appendix B
Logos
Appendix C
Patterns
Appendix D
275
276
~FQ Draft
Fonts
~FQ NLQ
~FQ OCR-A & B
Appendix E ~FF Draft
~FF Draft
~FF NLQ
Appendix E ~FF OCR-A & B
~FF OCR-A & B
~FH Draft
~FH NLQ
~FH OCR-A & B
Appendix E ~FH OCR-A & B
Command Table Description Inside Outside Pass
Commands
IFORM,C
IFORM,L
IFORM,R
Command Table Description Inside Outside Pass
290
Modplot
Appendix G
Control Panel Selection
Code V Command Character Cvcc Parameter Level 2 Menu
Smooth Parameter Menu Level
Cvcc Cmd Selections Menu Level
PN Then Parameter Menu Level
PY Then Parameter Menu Level
DarkBar Parameter Menu Level
Version Parameter Menu Level
Descender Descndr Parameter Menu Level
Zero Parameter Menu Level
Vscale Parameter Menu Level
296
PY/PN Data Processing
Appendix I PN Then Data Processing When PN Then = ALL
PY Then Data Processing When PY Then = None
Appendix I PY Then Data Processing When PY Then = Term
Block Character Size Expansion Factor Height Width
Block-Character Size Tables
50’ 302
Block Character Size Expansion Factor Height Width
Appendix J Block Character Size Table
Character Sets
Appendix K LCP Character Sets
German
US-ASCII
OCR-A Code
OCR-B Code
OCR-B Code
310
Barcode Code
Addendum to the Line Printer Graphics Applications Manual
Error Correction Number of Error
Number of Data Error Correction Codewords
Codewords
Stopt
Aspect
Code 128A Barcodes in PGL
CPI Ascii
Value Description
CPI OCR-A
CPI OCR-B
Field Description
Appendix L ISET/USET Commands In PGL
Character Set
Parameter
US Ascii
Appendix L 20 CPI Support In PGL
CPI Support In PGL
Index
Page
Page
Page
Page
US-ASCII
Page
Embarc
US-ASCII
328
Page
255557-001