Revision F January
Agilent Part Number E6380-90019
Page
Contents
Overview of the Test Set’s Built-In Tools
Cdma Measurements Screens and Control Fields
Analog Measurements Screens and Control Fields
Contents
Contents
Control Fields on the Configuration Screens 227
Configuration Screens and Control Fields
AMPS-TACS, NAMPS-NTACS Encoder and Decoder 253
Signaling Encoder and Decoder Screens and Control Fields
Connectors
Connectors
Error Messages
Accessories, Manuals, Support
General Information
Herstellerbescheinigung
Manufacturers Declaration
Safety Considerations
Adjustments described in the manual are performed with
Connected to the earth terminal of the power source
Instrument must be made inoperative and be secured against
Any unintended operation
Protective earthing ground incorporated in the power cord
This product is a Safety Class I instrument provided with a
Mains plug shall only be inserted in a socket outlet
Provided with a protective earth contact. Any interruption
Consumables
Lifting and Handling
Product Markings
Certification
Declaration of Conformity
Like-new
Defects in material and workmanship when properly installed
Its programming instructions due to such defects
Price upon prompt return of the product
Chapter
Assistance
Regional Sales and Service Office s
Power Cables
Power Cables
Straight/90 8120-1692 Inches, mint gray
Used in the following locations Peru
Used in the following locations Switzerland
Straight/90 8120-4754 Inches, dark gray
JIS C 8303, 100
90 /Straight 8120-1351 Inches, mint gray
LineNeutral
Straight/90 Used in the following locations System Cabinets
8120-4379 Inches, jade gray
Power Cables
Product Description
Sinad SNR
What is in This Manual
Documentation
Conventions Used in This Manual
Which Document is Required?
Document Navigation
Document Part Number Usage
Trademark Acknowledgments
Getting Started
Before Connecting a Radio on
Before Connecting a Radio
Changing the Test Set’s Display
Using the cursor-control Knob or Screen Keys
To change the measurement screen
Changing the Control Fields
Unit-of-Measure Field
To change a unit-of-measure field
To Change an underlined entry
Underlined Entry Field
To make a one-of-many choice
One-of-Many Field
Numeric-Entry Fields
Numeric-Entry Field
To change a value
Hexadecimal Values
Decimal Values
How do I Verify that the Test Set is Operating Properly?
Cdma Spectrum
Operating Overview
Operating Overview
ADC Full Scale ADC FS
Displaying Cdma Measurements
Magnitude Error, Phase Error
Selecting Code Domain Measurements
Diagram
Transmitter TXPower
Frequency Error, Frequency
Displaying Analog Measurements
RF Measurements
Displaying AF Measurements
Measurement AF Anl In Setting
FM Deviation, AM Depth, AC Level
SINAD, Distortion, SNR, AF Frequency, DC Level
Displaying SINAD, Distortion, SNR, DC Level, or AF Frequency
Displaying Measurement Results on a Meter Scale
To display the meter scale
To set the meter’s end points and scale intervals
Operating Overview
Calibrating the Channel Power Measurement Cdma Analyzer
Calibrating the Channel Power Measurement Code Domain
Calibrating the Adjacent Channel Power ACP Measurement
Changing the Increment or Decrement Setting
Using the Factor of 10 Increment/Decrement Keys
Specifying An Increment Value for the Arrow Keys or Knob
Using Measurement Limit Indicators
To reset or remove limits
To set high and low limits
To remove a limit
To set a reference
Setting a Measurement Reference
Averaging Measurements
To use measurement averaging
How the Test Set Averages Measurements
To set an RF Offset
Setting an RF Generator/Analyzer Offset
To save an instrument setup
Saving and Recalling Instrument Setups
To recall an instrument setup
Press Recall
To remove clear an individual save register
Poweron Settings
To clear all save registers
Register Names
Base Settings
Memory Considerations
Instrument Hardware Changes
Using Pre-Defined User Keys
Using User Keys
To assign local user keys
Assigning and Releasing User Keys
To release local user keys
To assign global user keys
Replacing Batteries
Overview of the Test Set’s
Overview of theTest Set’s Built-In Tools
Using the RF Tools Program
Software Menu Screen
Loading and Running RF Tools
Test Results/BTS Utility Setup Screens
Test Results/BTS Utility Setup
To use a printer for data collection
To use a laptop interface other than the BTS Laptop Utility
Swept Gain
Measurement Description
Making the Measurement
Selecting the Swept Gain Measurement Test
Level value to avoid damage to that device
Level for the Duplex OUT level in dBm parameter
Press k1 Begin Tst
Example of a Swept Gain Plot Screen
Discrete Frequency Insertion Loss
Specifications
Press k1 Proceed when you are finished with this screen.
Particular test
Second display is enlarged for easier reading
10 Selecting the Swept Insertion Loss Measurement
Swept Insertion Loss
11 Swept Insertion Loss Setups
Estimating Swept Insertion Loss Using a Single Connection
Swept Return Loss
Select Main Menu Swept Return Loss
13 Swept Return Loss Setups
Power level. To avoid damage to the ANT in port, enter an
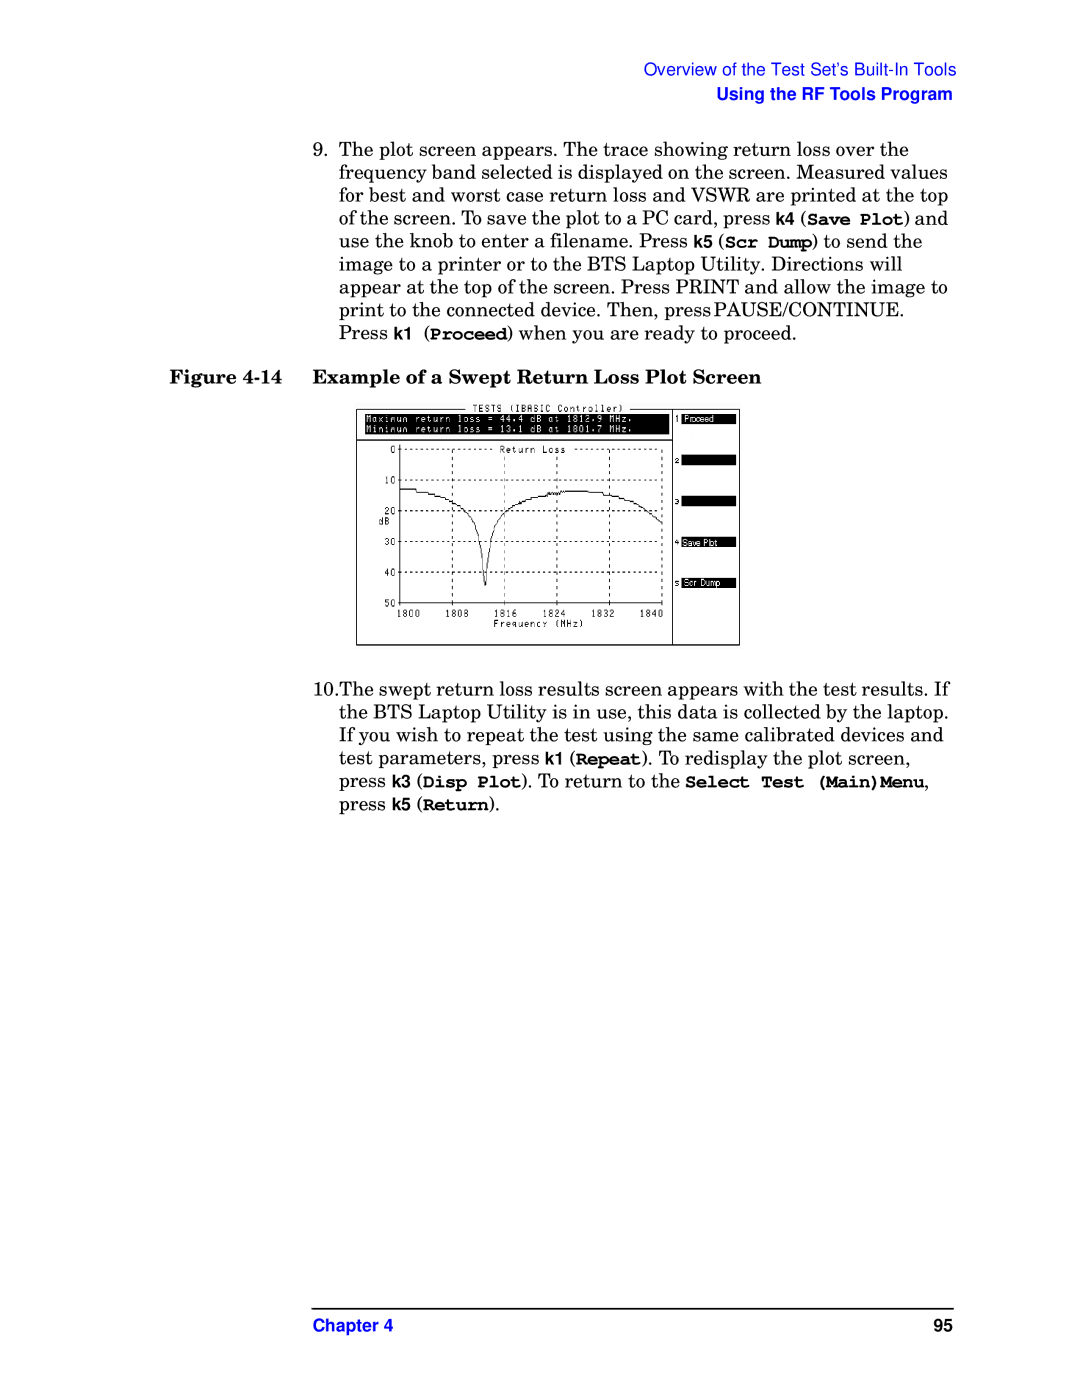
14 Example of a Swept Return Loss Plot Screen
Specifications
Test Signal Can Cause Interference
Cable Fault
Time domain can be used to find the physical distances.
Locations by viewing it in units of distance
Select Main Menu Cable Fault Measurement
Cable length, enter a value 1.5 times the estimated length
Greatest accuracy is obtained when you enter a cable length
Toggles the selection between feet and meters
K1 HELIAX, k3 RG, or k5 Custom
17 Cable Fault Setups
18 Example of a Cable Fault Plot Screen
Typical cable fault return loss measurements
Cable Fault Performance
Replot Data Files
Select Main Menu
21 Transfer Stored Data Screen
Transfer Stored Data
22 SA Self Calibration OFF/ON Screen
SA Spectrum Analyzer Self Calibration ON/OFF
Catalog PC Memory Card
23 Catalog Memory Card Screen
Selecting the Code Domain Analyzer’s Controls Menus
Using the Code Domain Analyzer
24 Code Domain Analyzer Menus IS-95
25 Code Domain Analyzer Menus IS-2000
Setting Resolution Bandwidth and Sweep Rate
Using the Spectrum Analyzer
Relationship between Span, Resolution Bandwidth, and Sweep
Automatic Calibration
26 Spectrum Analyzer Controls Menus
Selecting the Spectrum Analyzer’s Controls Menus
Using the Spectrum Analyzer’s Delta Markers
Delta Frequency
Delta Level
Reference Marker Ref Mrkr Level and Frequency
Displaying the Spectrum Analyzer Mask
Using the Spectrum Analyzer Mask
Defining the Fixed Mask’s Limits
Settings for mask in Figure
Point
Point Level Frequency
Defining the Relative Mask’s Limits
Turning Off the Mask
Turning Off the Mask’s Failure Beeper
Set to Audio
Using the Voltmeter and Audio Frequency Counter
Measuring AC and DC Voltages
AC Level Set to DC Level or AF Freq Set to match source
29 Inputs and Filters for the Oscilloscope
Using the Oscilloscope Scope
Selecting the Oscilloscope’s Input
Using the Oscilloscope’s Marker
Selecting the Oscilloscope’s Filters
Triggering the Oscilloscope
Copypl
Using Ibutil Programs
Securing aTest Procedure
Clearing RAM
Using the Listopts list options Program
Using the Demo Program
Step
Using the Stplt store or plot Program
Cdma Measurements Screens and Control Fields
130
Cdma Measurements
Average Power Measurements
Avg Pwr
Screens on which this measurement is displayed
Channel Power Measurements
Adjacent Channel Power Measurements
Screens on which this measurement is made
Chan Pwr
Rho
Rho Measurements
Frequency Error Freq Err
Estimated Rho Est Rho
Code DOM Code Domain Analyzer
Time Offset
Carrier Feedthrough
Chapter 137
Error Vector Magnitude EVM Measurements
Magnitude Error
Phase Error
Code Domain Measurements IS-95
Code Domain Power, IS-95
Code DOM Code Domain Analyzer, IS-95 only
Selecting Absolute or Relative Code Domain Power, IS-95 only
Fast Power
Code Domain Phase Phse
Code Domain Timing Timing
Code Domain Measurements IS-2000
Advantages of Using IS-2000
Interpreting IS-2000 Channel Ordering
Building a tree using the Bit Reverse method
Channel numbers. The Walsh index utilizes Walsh orders 0
Available Measurements in the Code Domain
11 Code Domain Power, Bit Reverse Ordering
Reading Code Domain Power, IS-2000
Code Domain Power, IS-2000
Code DOM Code Domain Analyzer, IS-2000
Code Domain Power & Noise
Code Domain Fast Power Synchronize
Code Domain Complex Power
PN Offset Search
IQ Constellation Diagram, IS-2000 only
# of Frames
Control Fields for Cdma Measurements
ACP Cal
ACP Fltr BW
ADCfs or ADC FS
ACP Offset
Amplitude
Code DOM Code Domain Analyze screen gain controls menu
Analyzer code domain analyzer
Analyzer Cdma analyzer
Anl Dir
COD DOM Code Domain Analyzer main controls menu
Auto Zero
Anl Special
Carrier FT or Carrier Feedthru
Chan Num
Chan Size
CD pwr unit
Chn Pwr Cal
Controls
CW RF Path
COD DOM Code Domain Analyzer all menus
Data Rate
Data Source
Even Sec
Find PN
Freq Err
Gain
Gen Dir
COD DOM Code Domain Analyzer gain controls menu
Gen Special
Gen Mode
Input Port
Input Atten
Lvl
Code DOM Code Domain Analyzer gain controls menu
Marker Lvl
Power Level
Marker Pos
Meas Intvl or Meas Int
Meas Order
COD DOM Code Domain Analyzer fast power setup controls menu
Measurement
Num Avgs
COD DOM Code Domain Analyzer FP setup controls menu
Phase/div
Ofs Trnsfer
Output Port
Phse
PN Incrment
PN Offset
Pwr Gain
PN Offset or PN Ofs
Pwr Ref
Pwr Intvl
Pwr Scale IS-95
Pwr Scale IS-2000
Qual Event
Pwr Zero
Rate RC-4
Rate RC-3
Rate RC-5
Code DOM Code Domain Analyzer trigger controls menu
RF Gen Freq
RF Channel
RF In/Ant
Screens on which this field is displayed
Sprd Fact Spread Factor
Start Frame
Threshold
Time/div
Time
Time Ofs
Time Offset
Tune Freq
Trig Event
Walsh Order
Walsh Chan
Control Fields
178
Analog Measurements
AC Control
AM Depth Measurement
DC Level Measurement
AF Freq Measurement
FM Deviation Measurement
Distn Distortion Measurement
Frequency Measurement
Frequency Error Measurement
TX Power Measurement
Is signal to noise ratio of the audio input signal
Sinad Measurement
SNR Measurement
Control Fields for Analog Measurements
Signaling Decoder All Modes
#Pts
AF Anl
AFGen1 Freq
AF Cnt Gate
AFGen2 Freq
AFGen1 To
AFGen2 To
Signaling Encoder All Modes
Spec ANL RF generator controls menu
Atten Hold
Audio Out
Audio In Lo
Auto/Norm
Scope trigger controls menu
Center Freq
Spec ANL all menus except mask controls
Spec ANL main controls menu
DC FM Zero
Cont/Single
De-Emp Gain
De-Emphasis
Detector
Display
Detector Types
EditPt
Edit Mask
Ext Load R
Ext TTL
Filter
FM Coupling
Freq Delta Mrkr
Freq mask
Reference Marker Frequency Level Delta Marker
Freq normal marker
Spec ANL all menus when in normal mode except mask controls
Freq Ref Mrkr
Normal Marker Frequency Level
If Filter
Gain Cntl
Spec ANL auxiliary controls menu
Input Gain
Internal
Level div
Level mask
Lvl Delta Mrkr
Lvl marker
Lvl normal marker
Scope all control menus
Marker To Peak+
Lvl Ref Mrkr
Marker To Peak
Scope marker controls menu
Mask Beep
Marker To
Mask Type
Spec ANL marker controls menu
No Pk/Avg
Mod In To
Norm/Delta
Normalize
Notch Freq
Notch Gain
Offset Freq
Pk Det To
Port/Sweep
Position
Scope marker controls menu Spec ANL marker controls menu
Pos/Neg
Ref Level
Ref Mrkr
Reset
RF Cnt Gate
Spec ANL RF generator or main controls menu
Key or turn the Test Set off and on to reset it
Maximum signal levels are printed on the connector panel
Spec ANL RF Gen controls menu
This field selects the input port for the spectrum analyzer
Sensitivity RF analyzer
Scope To
Settling
Sensitivity spectrum analyzer
Speaker ALC
Span
Speaker Vol
Sets the span of frequencies to be displayed on the screen
Squelch
This field selects the horizontal sweep time per division
Track/Fixed
Time-per-division is selected from a list of choices
Scope main controls menu
Resolution
Trig-Delay
TX Pwr Meas
Vert/div
TX Pwr Zero
Vert Offset
Configuration Screens
224
Setting the Date and Time
Configuring the Instrument
Changing the Beeper’s Volume
Turning Off User Messages
Configuring for Printing a Screen
Printing a Screen
To interrupt printing
Screens Where Field is Present
Control Fields on the Configuration Screens
Abort Print
Antenna
Beeper
Base Freq User Defined
Call
Chan Space User Defined
Cdma Std
230
Command Escape Character
Connection Time-out
Data Length
Date
Display User Messages
Duplex Out
FF at End
Ext Ref
FF at Start
Firmware
OUT connector
Inaccessible
Flow Control
Frame Clock Output
Gen-Anl User Defined
Gen-Anl
Hold-off Delay
Gpib Adrs
Ibasic Echo
Inst Echo
Incoming Call Security
Lines/Page
Mode
Model
Modem Configuration
Modem Mode
Modem Initialization/Configuration
Number to Call
Notch Coupl
Opt Cdma TB
Parity
Printer Adrs
Password
Printer Port
Print Title
Range Hold
Ref Select
Remote Mode
RF Chan Std
Retries
RF Display
RF Gen Volts
See the RF Chan Std on page 244 for more information
RF Level Offset
RF In/Out
Save/Recall
RF Offset
Serial9
Serial Baud
Serial No
This field displays the serial number of the Test Set
Serial Port
Status
Stop Length
Total RAM
Signaling Encoder and Decoder
Decoder’s Signal Source
Signaling Encoder and Decoder Screens
Decoder Frequency Measurements
Encoder
AMPS-TACS, NAMPS-NTACS Encoder and Decoder
Control and Voice Channel Identifiers
Encoder/Decoder Interaction
AMPS-TACS, NAMPS-NTACS Decoder
Decoder Mode Differences
Interpreting Decoded Data
Recc and AMPS-TACS RVC Measurements
Decoding the Reverse Control Channel Recc Data
Measure Field
NAMPS-NTACS Reverse Voice Channel Measurements
Decoding NAMPS-NTACS Reverse Voice Channel RVC Data
Measurement Limits
Dtmf Sequence Encoder and Decoder
Decoding Considerations
Function Generator Encoder and Decoder
Delay
Control Fields for the Signaling Encoder and Decoder
Arm Meas
Bursts
Busy/Idle
Signaling Decoder Modes AMPS-TACS, NAMP-NTAC
Channel
Data hex
Signaling Encoder
Signaling Decoder
Data Level
Data Rate analog
Signaling Encoder Modes NAMP-NTAC
Signaling Decoder Modes NAMP-NTAC
DSAT/DST hex
Data you enter here
Filler Focc
Frequency
Gate Time
Hi Tone
De-emphasis Effects on Input Level
Input Level
Signaling Decoder All Modes
Examples of Input Level Settings
Lo Tone
Measure
AMPS-TACS/NAMPS-NTACS Focc Message and Filler Data Format
Message Focc
Message FVC AMPS-TACS
Signaling Encoder Modes AMPS-TACS
Message/DST FVC
Message FVC NAMPS-TACS
Signaling Encoder Modes Dtmf Signaling Decoder Modes Dtmf
Signaling Decoder All Modes Signaling Encoder All Modes
Num of Bits
Off Time
Polarity
On Time
Normal Operation
Inverted Operation
Pre-Emp
Signaling Encoder Modes Dtmf
Recc Data hex
SAT Freq FVC
Send
Send Dsat FVC
Send Filler Focc
Signaling Encoder Modes Func Gen
Send Mode
Sine Units
Single/Cont
Stop
Standard
Decoder Operating Considerations
Encoder Operating Considerations
Stop Dsat FVC
Symbol Frequencies Hz
Stop Filler Focc
Stop Meas
Signaling Decoder Modes AMPS-TACS, NAMP-NTAC, Func Gen
Trigger Pattern bin
Trig Level
Twist and Pre-emphasis Interaction
Twist
Examples of Twist and Pre-emphasis Interaction
Example
Waveform
Connectors
Operating Considerations
Connectors
ANT
Audio
Audio OUT
Data
EXT REF
EXT Scope Trig
Parallel Port Pin Assignments
Parallel
RF IN/OUT
Serial Port Pin Assignments
Serial 9, 10,
Serial Port Pin Assignments
Pin Description
Video OUT
Accessories, Manuals, Support
Modifications
Accessories
Agilent Technologies Accessories
External Monitor
Agilent Technologies Manuals English and Other
Options
Agilent Technologies Test Software
Number Description
Order Description Number 1D5 High Stability Reference
Support for Your Instrument
Getting Help
Customer Training
Agilent Regional Sales and Service Offices
Error Messages
Positive Numbered Error Messages
General Information About Error Messages
Example 11-1 Positive numbered error messages take the form
Example 11-2 For example
Ibasic Error Messages
Negative Numbered Error Messages
Example 11-4 Ibasic error messages take the form
Example 11-3 For example
Text Only Error Messages
Gpib Error Messages
Example Gpib error messages take the form
Example Text only error messages take the form
Non-Recoverable Firmware Error
Message Display
Warbles and Beeps
304
Chapter 305
306
Index
308
Index 309
310
Index 311
312
Index 313
314
Index 315
316
Index 317
318
Index 319
320
Index 321
322
Index 323
324