DSP-100/2000
Users Manual
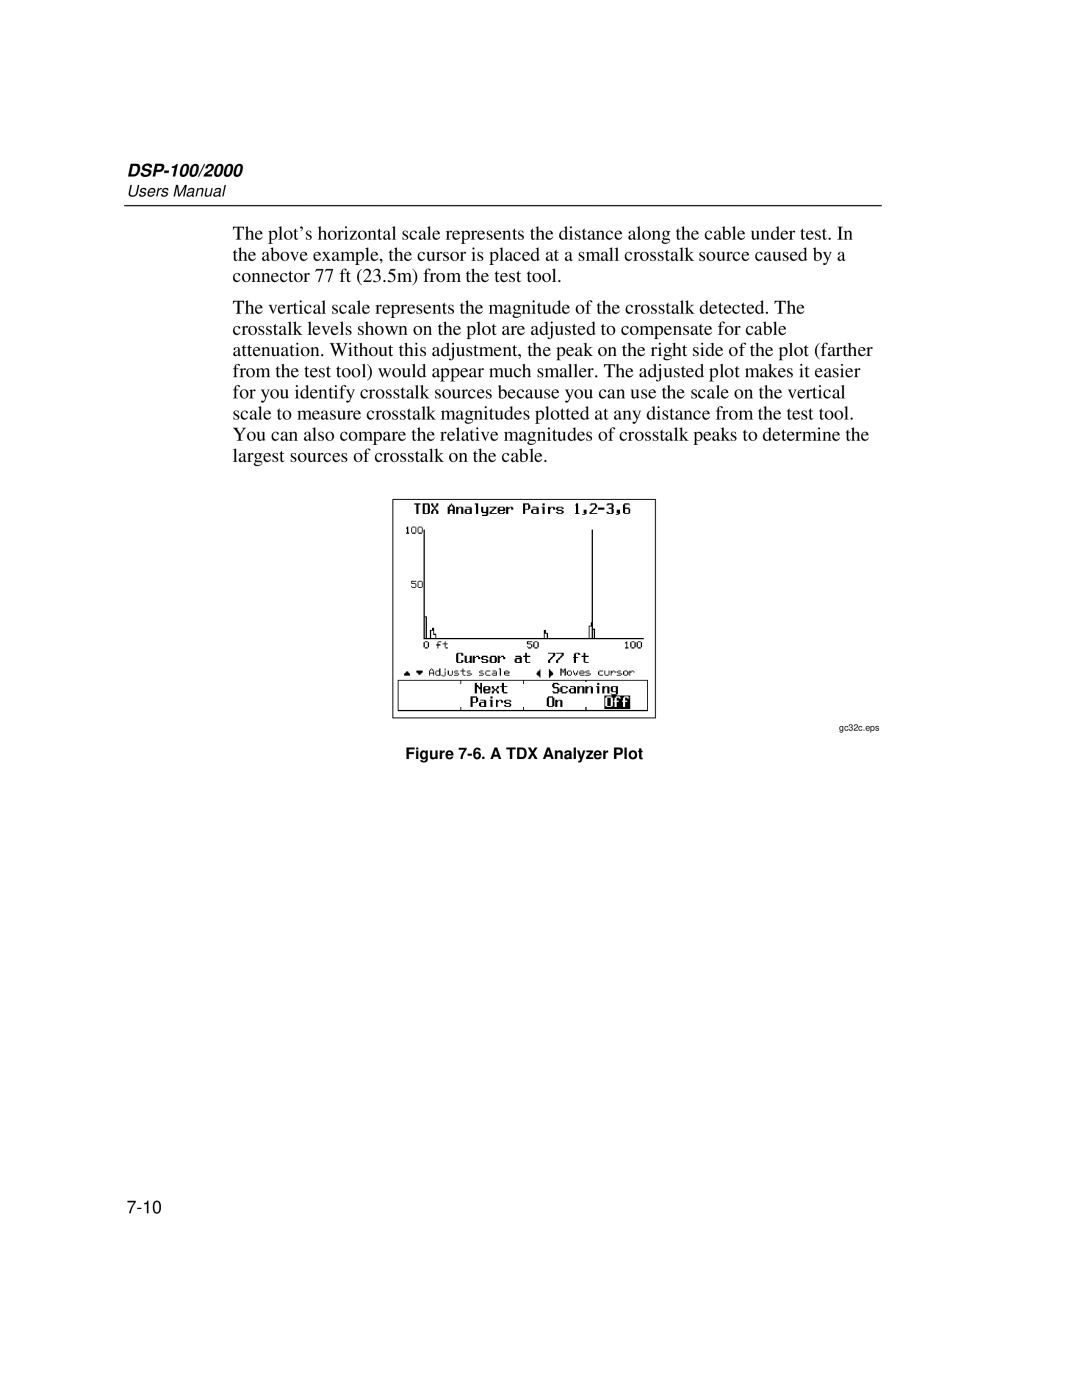
The plot’s horizontal scale represents the distance along the cable under test. In the above example, the cursor is placed at a small crosstalk source caused by a connector 77 ft (23.5m) from the test tool.
The vertical scale represents the magnitude of the crosstalk detected. The crosstalk levels shown on the plot are adjusted to compensate for cable attenuation. Without this adjustment, the peak on the right side of the plot (farther from the test tool) would appear much smaller. The adjusted plot makes it easier for you identify crosstalk sources because you can use the scale on the vertical scale to measure crosstalk magnitudes plotted at any distance from the test tool. You can also compare the relative magnitudes of crosstalk peaks to determine the largest sources of crosstalk on the cable.
gc32c.eps
