Using | A |
Formatting Hints for Uploaded Reports |
Table
Quick Plot
Description of Related Function or Term
Using a Mouse to Control the Cursor: When the pointing hand is shown on the plot, you can move the cursor by sliding the mouse from side to side. To freeze the cursor at a point on the line, click the mouse. Click again to move the cursor. To move the cursor to a different plotted line, click on a cable pair listed near the
Using a Keyboard to Control the Cursor: Use the left and right arrow keys to move the cursor in 100 kHz increments. Use the shift key with the arrow keys to move the cursor in 1 MHz increments. To move the cursor to a different plotted line, use the up and down arrow keys to move the cursor up and down among the cable pairs on the plot.
To View Pairs One at a Time in Forward or Reverse Sequence: Use the tab and
Formatting Hints for Uploaded Reports
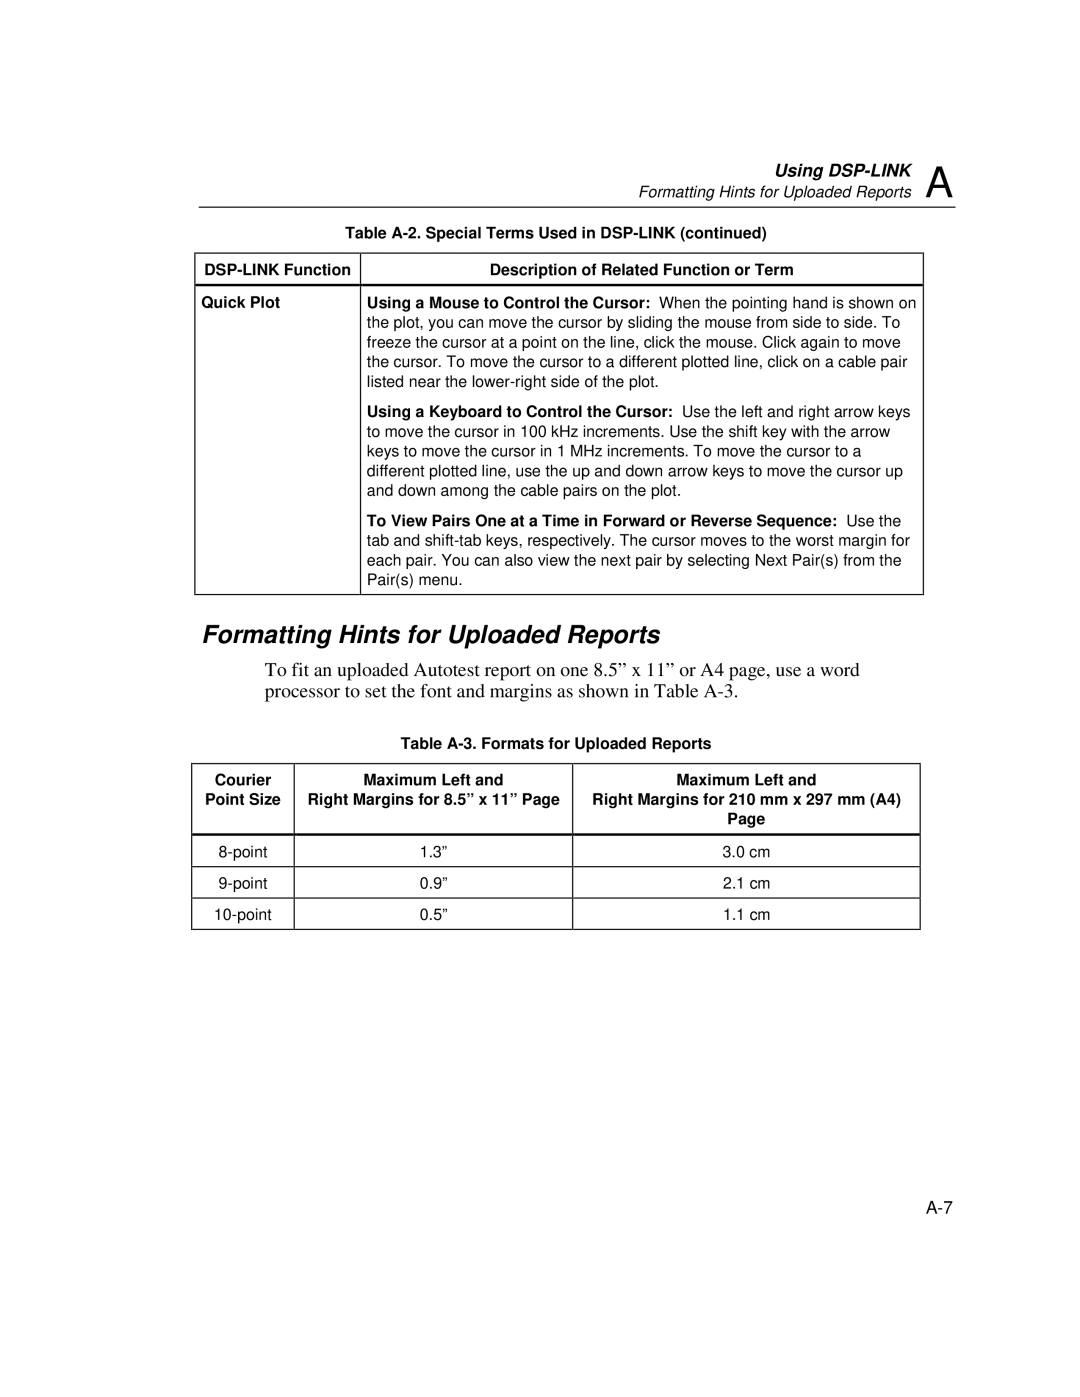
To fit an uploaded Autotest report on one 8.5” x 11” or A4 page, use a word processor to set the font and margins as shown in Table
Table A-3. Formats for Uploaded Reports
Courier
Point Size
Maximum Left and Right Margins for 8.5” x 11” Page
1.3”
0.9”
0.5”
Maximum Left and
Right Margins for 210 mm x 297 mm (A4)
Page
3.0cm
2.1cm
1.1cm
