DSP-100/2000
Users Manual
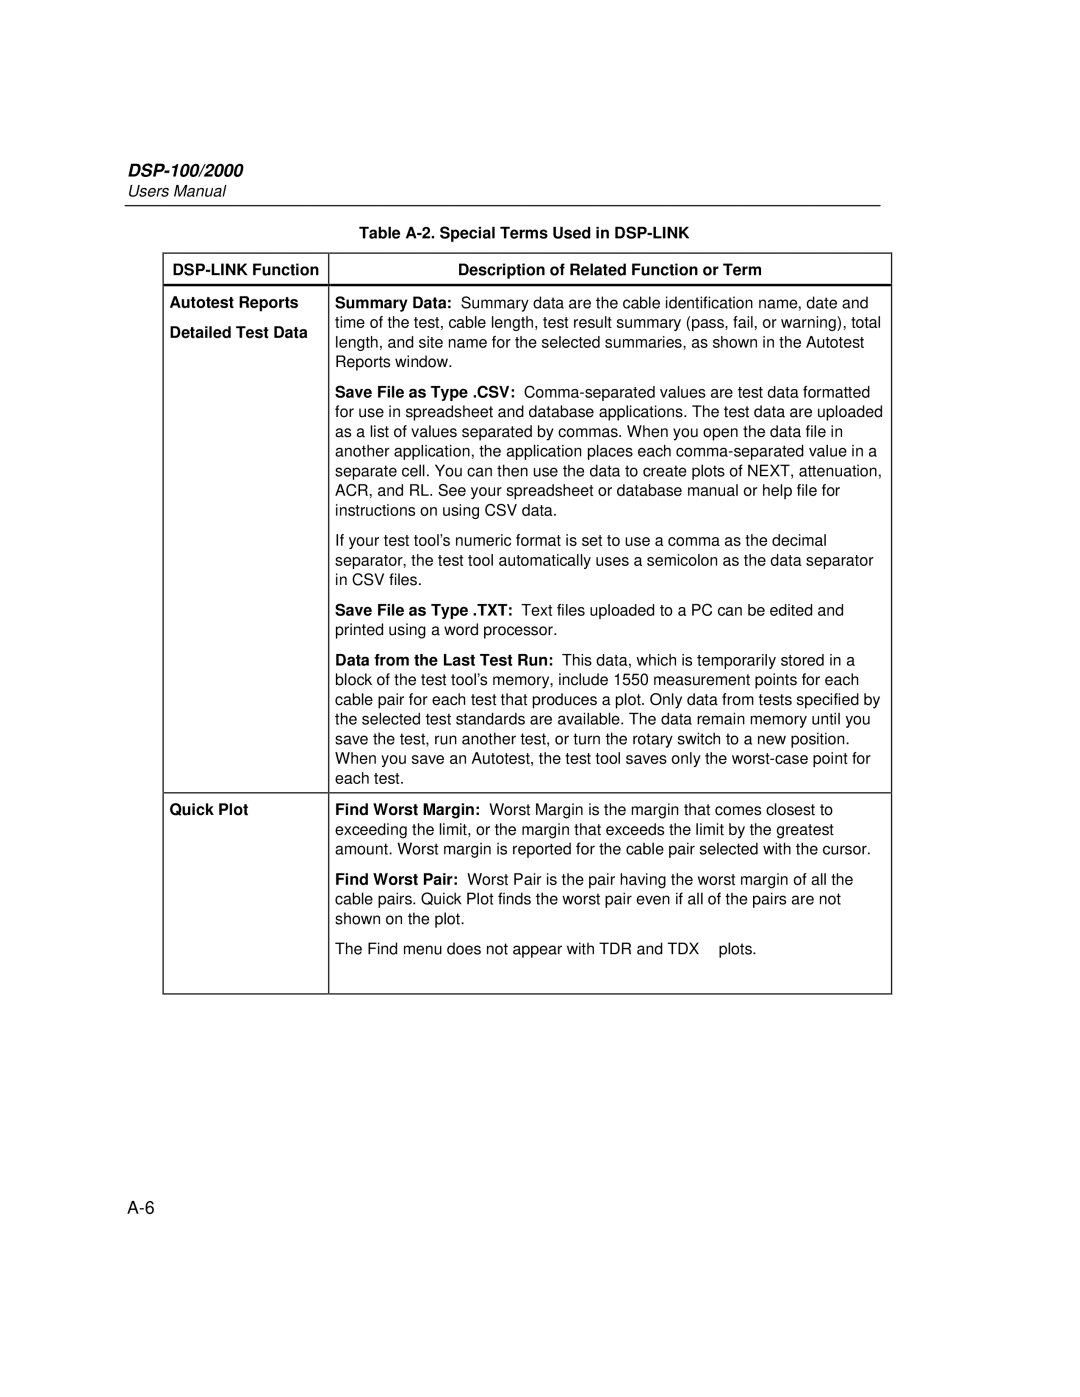
Table
Autotest Reports Detailed Test Data
Quick Plot
Description of Related Function or Term
Summary Data: Summary data are the cable identification name, date and time of the test, cable length, test result summary (pass, fail, or warning), total length, and site name for the selected summaries, as shown in the Autotest Reports window.
Save File as Type .CSV:
If your test tool’s numeric format is set to use a comma as the decimal separator, the test tool automatically uses a semicolon as the data separator in CSV files.
Save File as Type .TXT: Text files uploaded to a PC can be edited and printed using a word processor.
Data from the Last Test Run: This data, which is temporarily stored in a block of the test tool’s memory, include 1550 measurement points for each cable pair for each test that produces a plot. Only data from tests specified by the selected test standards are available. The data remain memory until you save the test, run another test, or turn the rotary switch to a new position. When you save an Autotest, the test tool saves only the
Find Worst Margin: Worst Margin is the margin that comes closest to exceeding the limit, or the margin that exceeds the limit by the greatest amount. Worst margin is reported for the cable pair selected with the cursor.
Find Worst Pair: Worst Pair is the pair having the worst margin of all the cable pairs. Quick Plot finds the worst pair even if all of the pairs are not shown on the plot.
The Find menu does not appear with TDR and TDX™ plots.