DSP-100/2000
Users Manual
TDX Analyzer Plot
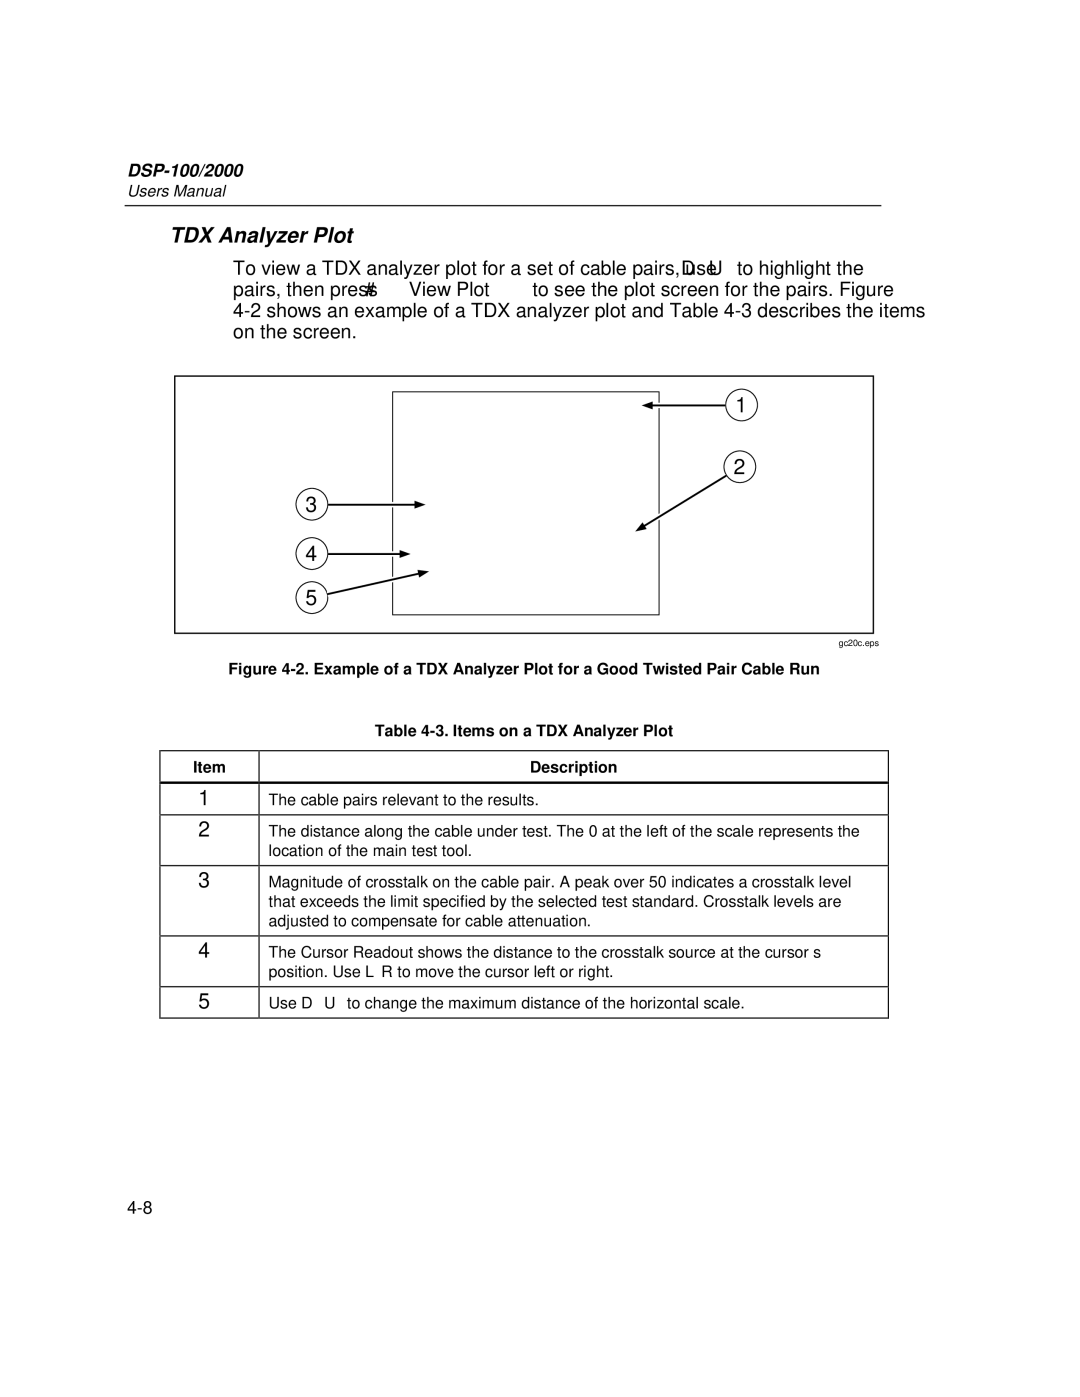
To view a TDX analyzer plot for a set of cable pairs, use DUto highlight the pairs, then press #View Plot to see the plot screen for the pairs. Figure
3 |
4 |
5 |
1
2
gc20c.eps
Figure 4-2. Example of a TDX Analyzer Plot for a Good Twisted Pair Cable Run
Item
1
2
Table 4-3. Items on a TDX Analyzer Plot
Description
The cable pairs relevant to the results.
The distance along the cable under test. The 0 at the left of the scale represents the location of the main test tool.
3
4
Magnitude of crosstalk on the cable pair. A peak over 50 indicates a crosstalk level that exceeds the limit specified by the selected test standard. Crosstalk levels are adjusted to compensate for cable attenuation.
The Cursor Readout shows the distance to the crosstalk source at the cursor’s position. Use LRto move the cursor left or right.
5
Use DUto change the maximum distance of the horizontal scale.
