Basic Cable Testing 7
Troubleshooting Basics
Table 7-1. Identifying Cable Faults (continued)
Examples of Test Displays and Plots
gc63i.eps
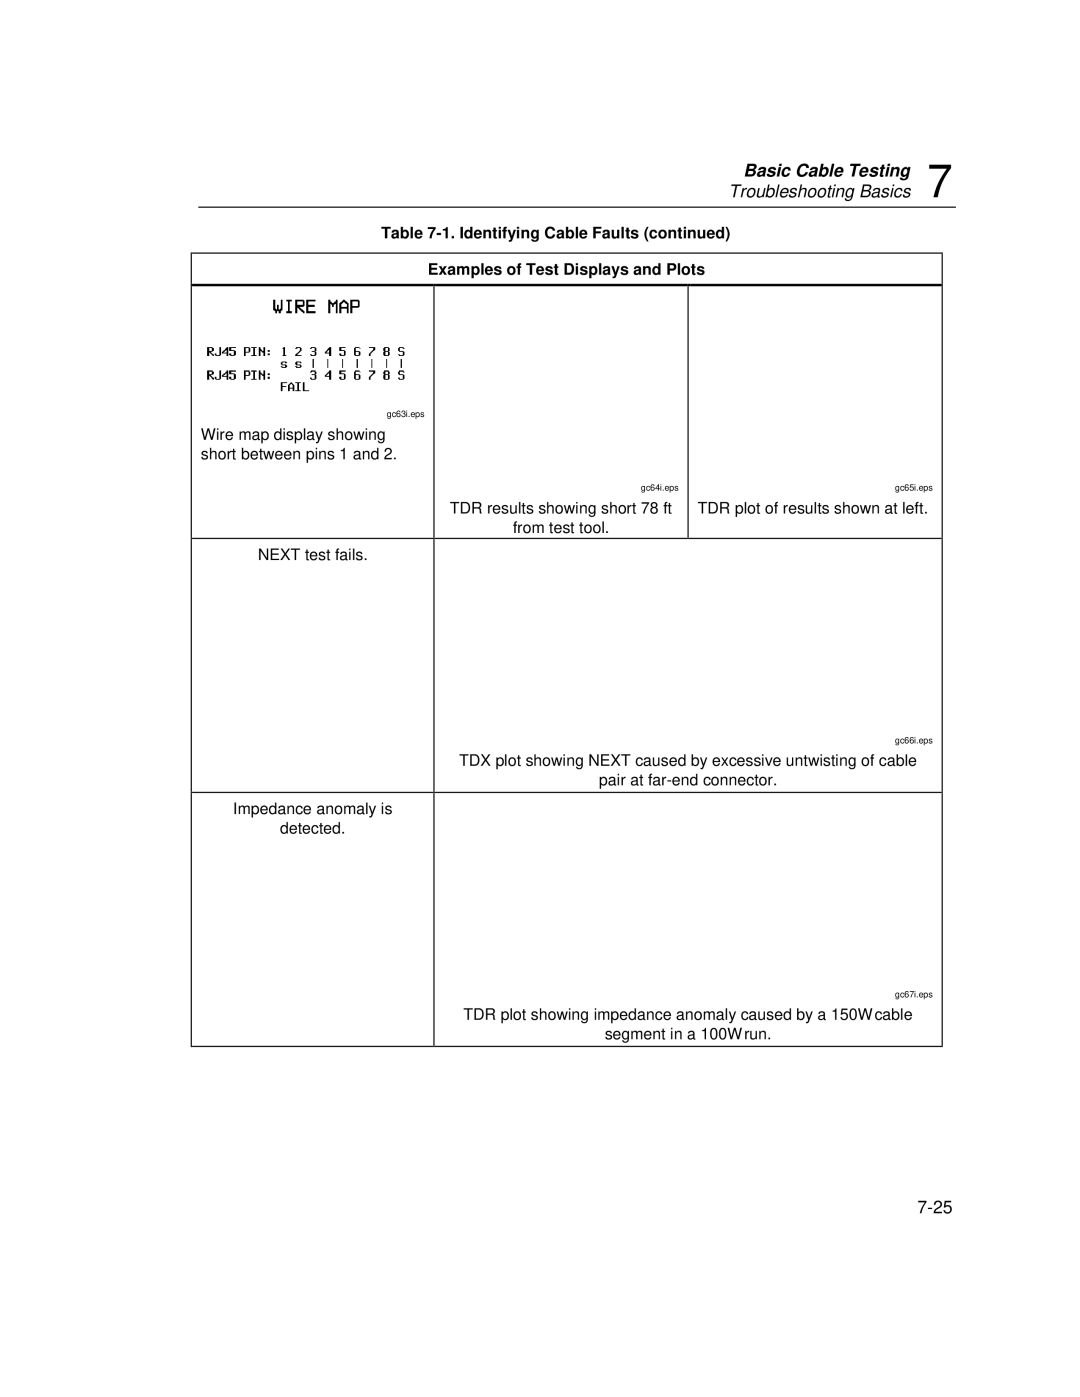
Wire map display showing short between pins 1 and 2.
NEXT test fails.
Impedance anomaly is
detected.
gc64i.eps | gc65i.eps |
TDR results showing short 78 ft | TDR plot of results shown at left. |
from test tool. |
|
gc66i.eps
TDX plot showing NEXT caused by excessive untwisting of cable
pair at
gc67i.eps
TDR plot showing impedance anomaly caused by a 150Ω cable
segment in a 100Ω run.
