G600
August
Aviation Limited Warranty
Foreword
Iii
System Foreword
190-00601-02 Rev. E Garmin G600 Pilot’s Guide
Production release
Update information
Updates for SW Version
Date Description
Contents
10.4
10.1
10.2
10.3
5.1
1.5
1.6
1.7
7.6
3.2
3.3
3.4
Nexrad
10.2.1
10.1.1
10.1.2
10.1.3
11.11
11.8
11.9
11.10
3.6
4.1
4.2
3.5
System Description
G600 System LRU Configuration
Sec System
Line Replaceable Units LRU
GDU 620 PFD and MFD
2 GDU
4 GRS
GDC 74A/74B
8 GSR
5 GMU
GTX 330/330D Optional
7 GTP
10 GAD
GDL 69/69A Optional
Garmin Navigator Interface
GWX 68 Weather Radar
Ahrs Operation
12 Ahrs Operation
13 Track Mode shown as Active when Heading Info has failed
When Heading Fails
Inserting an SD Card
Secure Digital Cards
System Power Up
Terrain database name and version
International Geomagnetic Reference Field
Turn the PFD knob to select the desired value
System Operation
Pilot Controls
PFD Knob
Heading HDG
PFD Bezel Keys
MFD Knobs
Vertical Speed Bug Setting
MFD Bezel Keys
Using the Soft Key Controls
Selected Soft Key Unselected Soft Keys Soft Key Labels
No Options Options for MAP Window
Using the Page Menus
Press the Menu key to display the menu
Navigating within a Menu
20 System Setup
System Settings
System Settings Values
Celsius
Meters Vertical Speed Indicator Navigation
Setting Hectopascals Hpa
Altitude Feet All elevations on MFD Altimeter
Manual Adjustment 0.1% to 50% or Auto 1.7% Auto or Manual
Backlighting Adjustment
Display Backlighting
Vertical
Indicator
Current
Barometric
Selected Soft Key
PFD Soft Keys
CDI
SYN VIS
Airspeed Tape
Airspeed Indicator
Overspeed Indication
Markings
White Triangle
Reference Speeds
Pitch Scale Slip/Skid Indicator
Attitude Indicator
Roll Scale
Roll Pointer Roll Scale Zero
Extreme Attitude
PFD Knob Mode Annunciations
Roll Scale Zero Pointer Roll Pointer
15 Extreme Pitch Indication
Nose Up
Altimeter
Setting the Altitude Bug and Alerter
19 Ground Awareness Band Showing Ground Is Within 250 Feet
20 Altitude Alerting Visual Annunciations
Altitude Alerting
Alerting
Changing Barometric Setting
Press the Baro key to activate Baro mode
Baro Setting
Barometric Minimums Bug Box
Cyan Within 2500 ft White Within 100 ft
190-00601-02 Rev. E Garmin G600 Pilot’s Guide
Setting the Vertical Speed Indicator Bug
Vertical Speed V/S Indicator
Vertical Speed Settings
Rotating Compass Card Lubber Line OBS Mode Active
Horizontal Situational Indicator
Trend Vector Current Heading
New Heading Bug Setting True North
Setting the Heading Bug
Current Heading Magnetic North
360º HSI
Course Deviation Indicator
Turn Rate Indicator
Error
Navigator
Changing CDI Sources
Changing CDI Course
New Course Setting
Vertical Deviation Source Vertical Deviation Indicator
Vertical Deviation Indicator VDI
Press the 1-2 soft key twice NAV1NAV2NAV1
Auto-Slewing
Approach Plate
Course Pointer slewed To 218 for the ILS
Bearing Pointers
Supplemental Flight Data
Corresponding Approach Plate
GPS Level
Service
Bearing
Wind Vectors
Temperature Display
Style
40 Radar Altimeter Display 150 foot RA Altitude
Radar Altimeter
42 Radar Altimeter Test Annunciation
Press the RA Test key again to stop the self-test
This page intentionally left blank
Labels
Group Position Label SD Card Slots
Select Large MFD Knob Select Page Group
Aux Group
Functional Display Map
Map Group Wx Group opt
MFD Soft Key Map
Map orientation
Icons for enabled map features
Navigation Map Pages
Map range
Group
Default Navigation Map
Editing Information
Selecting Page Options
Decluttering Map Pages
Changing the Navigation Map Range
Map Range Overzoom Icon Map Range
Features Shown at Each Decluttering Level
Feature
Map Pointer
Panning
Press the small MFD knob again to return to panning
Selecting Items on the Map
Press the small MFD knob to stop measuring
Measuring Distances
Customizing Navigation Map Pages
Map Setup
Press the small MFD knob to return to the Navigation Map
Navigation Map Page Menu Selections
Map Orientation
Map Feature Options
18 Navigation Map North Up At Orientation Range Selection
North Up At
Activating Auto Zoom
OBS mode is turned off
Turn the small MFD knob to select On or Off
Auto Zoom
20 Navigation Map Land Data
Land Data
Track Vector Aircraft Present Position
Track Vector Length
Wind Vector
Turn the small MFD knob to select the On or Off
Range Ring Radius Range Ring with Compass Rose
Nav Range Ring
Topo Data Off Topo Data On
Topo Data
190-00601-02 Rev. E Garmin G600 Pilot’s Guide
29 Navigation Map Topo Scale
Topo Scale
Terrain Data Off
Terrain Data
Terrain Data Terrain Elevation Scale Terrain Data Icon
33 Navigation Map Terrain Scale
Terrain Scale
36 Terrain Altitude/Color Correlation
Obstacle Data Viewing Range
38 Navigation Map Obstacle Data Selection
Turn the small MFD knob to select the viewing range or Off
Lat/Lon Reference Information
Lat/Lon Viewing Range
41 Navigation Map Field of View Selection
Field of View
42 Navigation Map Field of View on the MFD
Field of View Borders
Press the small MFD knob to return to the Navigation Map
Weather Feature Options Optional
45 Nexrad Viewing Range Selection
Nexrad Viewing Range
Nexrad Cell Movement
Turn the small MFD knob to turn the function on or off
47 Nexrad Legend Selection
Nexrad Legend
48 Lightning Viewing Range Selection
Lightning Viewing Range
Traffic Alerts Only displayed
Traffic Feature Options Optional
No traffic displayed
All types of traffic displayed
50 Navigation Map Page Menu Traffic Options
Aviation Feature Options
52 Navigation Map Safe Taxi Viewing Range Selection
SafeTaxi Viewing Range
53 Navigation Map Runway Extension Selection
Runway Extension Range
54 Navigation Map INT/NDB Viewing Range Selection
INT/NDB Viewing Range
55 Navigation Map VOR Viewing Range Selection
VOR Viewing Range
56 Navigation Map Class B/TMA Viewing Range Selection
Class B/TMA Airspace Viewing Range
57 Navigation Map Class C/TCA Viewing Range Selection
Class C/TCA Airspace Viewing Range
58 Navigation Map Class D Viewing Range Selection
Class D Airspace Viewing Range
Restricted Airspace Viewing Range
60 Navigation Map MOA Military Viewing Range Selection
MOA Military Viewing Range
61 Navigation Map Other/ADIZ Viewing Range Selection
Other/ADIZ Airspace Viewing Range
62 Navigation Map TFR Viewing Range Selection
TFR Viewing Range optional
63 Airways Selection
Airways
Selected Video Source
Split Screen Optional
Current Video Source
Map Display
Airspeeds Glide, VR, VX, and VY
Aux Mode Pages
Dual Unit Synchronization CDI and Baro
Display Brightness
67 Aux Mode System Setup Page Menu
Airspeed Reference Marks
69 Aux Mode Display Brightness Mode Selection
PFD Options Wind Vector
Turn the small MFD knob to select the value and press ENT
Turn the small MFD knob to select the style and press ENT
Turn the small MFD knob to select on or OFF Press ENT
Synchronization Dual Installations Only
Barometric Correction default on Selected CDI default OFF
U.S. Time Zone Offsets
Date and Time
MFD Display Units
Press the small MFD knob to exit adjustments
76 Altitude and Vertical Speed MFD Display Units
System Display Units
XM Information Optional
79 Temperature System Display Units
81 XM Entertainment Radio
XM Entertainment Radio Optional
Scroll Bar
System Status
Select Video Source
External Video optional
Zoom
Setup
Panning
Contrast Adjustment
Brightness Adjustment
While viewing the External Video page, press the Menu key
Restore Defaults
Restore Defaults will be highlighted. Press the ENT key
Saturation Adjustment
Status
Position Reporting optional
Report Type
Press the small MFD knob to exit editing
Turn the small MFD knob to select the reporting frequency
Send Soft Key Label
94 Select AFF Reporting Period Frequency
Automatic Flight Following AFF
Iridium Phone Operation Optional
Call Suppression
Turn the small MFD knob to highlight the desired selection
Received through the Iridium phone
Outgoing calls are not affected
Creating Phone Number Names
Managing the Phone Book
98 Phone Book Number Entry
Creating Phone Numbers with the Rotary Knobs
Creating Phone Numbers with Soft Keys
Press the key for the group of desired numbers
Selecting a Phone Book Catalog Entry
Editing a Phone Book Catalog Entry
Phone Volume
Adjusting the Phone Volume with the Rotary Knobs
Deleting a Phone Book Catalog Entry
Attenuate
Adjusting the Phone Volume with the Soft Keys
Making a Phone Call
Press to
106 Incoming Call Pop-Up
Answering a Phone Call
Active Flight Plan
Flight Plan Pages
For Waypoint
Active Flight Plan Options
Active Flight Plan Detail
To change data fields on the Active Flight Plan
Press the small MFD knob to remove the cursor
Setting the Altitude Minimums Alerter
Lat/Lon
Waypoint Information
Press ENT to activate the selected value
Facility Name Facility Location Map Orientation
Turn the small MFD knob to show FPL, NRST, or Recent
Selecting a Waypoint
Facility Information Window Runway
Waypoint Information Detail
Airport Frequency Window
Facility Name
Ident/Facility/City Selection
City
Runway Information Selection
Press the small MFD knob to exit
Facility Frequency Selection
Press the small MFD knob to activate the cursor
Airport Directory
122 Waypoint Weather Information Textual METARs and TAFs
Waypoint Weather Information Optional
123 Flight Page 3 Charts
Charts Page Optional
124 Chart Scroll Bars Charts
Viewing Charts
Press ENT to display the desired chart
Selecting a New Chart by Airport
Change Day/Night View
Selecting a New Chart by FPL, NRST, or Recent
Traffic Avoidance
Terrain Configurations
Terrain Proximity TAWS-B Optional Terrain-SVT Optional
Terrain Avoidance
500W-series Taws Unit No MFD Annunciations
Are generated Unit Installed
G600 Terrain None Proximity
None Proximity w Annunciations
Terrain Scale Color Codes
Terrain Scale
Terrain is more than 100 ft above the aircraft
Terrain is more than 1000 ft below the aircraft
Terrain Proximity
System must have a valid 3-D GPS position solution
Terrain Proximity Page Display on the Terrain
Displaying Terrain Proximity
Turn the large MFD knob to the MAP page group
Turn the small MFD knob to the Terrain
Terrain Proximity Page Display on a Navigation Map
Terrain Proximity Page 120 Arc or 360 Rings
Press ENT to save the highlighted value
Terrain Proximity Page Aviation Data
Navigation Map Page with Terrain Data Displayed
Terrain Proximity Limitations
TAWS-B Requirements
Terrain Awareness and Warning System TAWS-B Optional
TAWS-B Limitations
Baro-Corrected Altitude Versus GPS-MSL Altitude
Computing GPS Altitude for Taws
Displaying Taws Data
Using Taws
Location
Taws
Displaying Taws Information
Press the RNG keys to display a larger or smaller area
Changing the Taws Page View Between 360 and Arc
Showing/Hiding Aviation Information on the Taws
Manually Testing the Taws System
Taws System Test OK Taws System Failure
Press the ENT key to confirm the selection
Taws Alert Pop-Up Key presses to continue
Taws Alerts
Taws Alert Colors and Symbology
TAWS-B Alerting Colors and Symbology
ROC-C, IOI-C
RTC-W, ITI-W Pull Up
ROC-W, IOI-W Pull Up
RTC-C, ITI-C
18 Excessive Descent Rate Alert Criteria
Excessive Descent Rate Alert
Premature Descent Alerting
Forward Looking Terrain Avoidance
19 PDA Alerting Threshold
Five-Hundred Aural Alert
Inhibiting/Enabling Taws Alerting
21 Negative Climb Rate NCR Alert Criteria
Negative Climb Rate After Take-Off Alert NCR
Taws Not Available Alert
Taws System Status
Taws Failure Alert
22 Taws Annunciations from a 500W-series Unit
External Taws
Terrain-SVT
23 Terrain-SVT 360 and Arc Views
Terrain-SVT Page 120 Arc or 360 Rings
Inhibiting/Enabling Terrain-SVT Alerting
Terrain-SVT Page Aviation Data
27 Terrain-SVT Advisory Pop-Up on the MFD
Synthetic Vision Alerts and Annunciations
No GPS position
Signal
Terrain-SVT Alerts Summary
Displaying and Operating Traffic TAS Systems
TAS Traffic Optional
Range Ring
Switching from Standby Mode to Operating Modes
Displayed Traffic Range
Changing the altitude display mode
Altitude Display
Below Ft to 2700 ft
TAS Symbology
13 TAS Failure Annunciations
Traffic System Status
Unit is self-reporting a failure
12 TAS Modes
14 TAS Traffic Status Annunciations
Selected display range
Traffic Pop-Up
Traffic Pop-Up
Traffic Map
TIS Traffic Optional
30 Traffic Map Page TIS
Displaying traffic on the Traffic Map
15 TIS Traffic Symbols
TIS Symbology
TIS Limitations
190-00601-02 Rev. E Garmin G600 Pilot’s Guide
TIS Alerts
16 TIS Failure Annunciations
TIS System Status
Press the ENT key
Switching Between TIS Operating Modes
From the display
Traffic service is unavailable or out of range
Display range
Descending
XM Weather Optional
Using XM Satellite Weather Products
Customizing the XM Weather Map
Press ENT to save a selection
32 Weather Data Link Setup Menu Options
19 Weather Page Menu Setup Options
Menu Item Adjustment
Winds Aloft County Warnings Cyclone Warnings
XM Weather Symbols and Product Age
20 Weather Product Symbols and Aging Times
Are Mutually Exclusive
21 Weather Symbols
34 Weather Legends
Weather Legends
35 XM Weather Nexrad
Nexrad
36 Nexrad Weather Legend
Reflectivity
Nexrad radar images may have certain limitations
Nexrad Limitations
Nexrad Data Viewing Range
Weather Page Map Orientation
39 Nexrad Legend Selection
Nexrad Legend
40 XM Weather Echo Tops
Echo Tops
41 Echo Top Viewing Range Selection
Echo Top Data Viewing Range
42 XM Weather Cloud Tops
Cloud Tops
43 Cloud Top Viewing Range Selection
Cloud Top Data Viewing Range
Lightning Data Viewing Range
XM Lightning
46 XM Weather Cell Movement
Cell Movement
47 Cell Movement Viewing Range Selection
Cell Movement Data Viewing Range
48 XM Weather AIRMETs
SIGMETs and AIRMETs
49 SIGMET/AIRMET Viewing Range Selection
SIGMET/AIRMET Viewing Range
50 XM Weather Graphic METARs
METARs
51 Metar Viewing Range Selection
Metar Viewing Range
52 XM Weather Surface Analysis and City Forecast
Surface Analysis and City Forecast
55 XM Weather Stationary Front
Surface Data Viewing Range
58 Surface Data Time Selection
Surface Data Time
59 XM Weather Freezing Levels
Freezing Level
60 Freezing Level Viewing Range Selection
Freezing Level Viewing Range
61 XM Weather Winds Aloft
Winds Aloft
63 Winds Aloft Data Viewing Range Selection
Winds Aloft Data Viewing Range
64 Winds Aloft Altitude Selection
Winds Aloft Altitude
65 XM Weather County Warnings
County Warnings
66 County Data Viewing Range Selection
County Data Viewing Range
Garmin GWX 68 Radar Description
Weather Radar
Principles of Pulsed Airborne Weather Radar
67 Radar Beam from 12 inch Antenna
Antenna Beam Illumination
Compensates for much of this distance attenuation
Radar Signal Attenuation
Precipitation
Radar Signal Reflectivity
Angle of Incidence
Ground Returns
Maximum Permissible Exposure Level Mpel GWX
Operating Distance
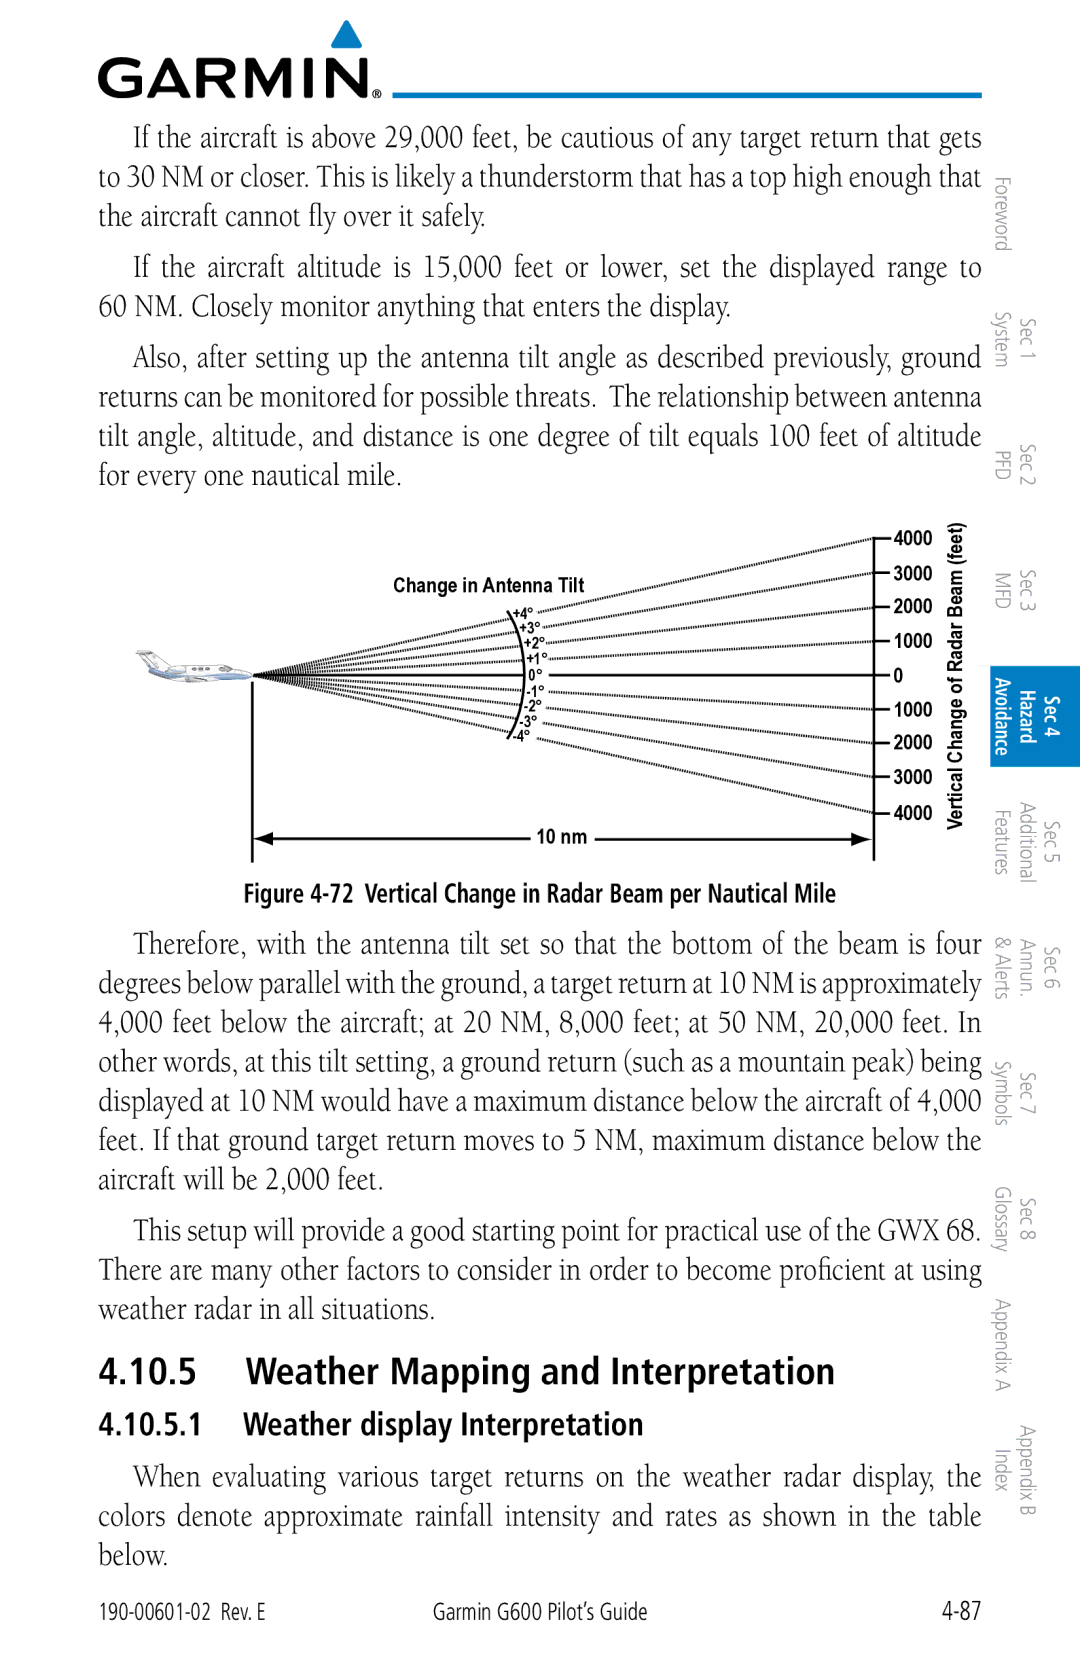
Practical Application Using the Basic Tilt Setup
Basic Antenna Tilt Setup
Weather display Interpretation
Weather Mapping and Interpretation
22 Precipitation Intensity Levels
Thunderstorms
73 Cell Irregularities
Squall Line Steep Gradient Hook or Finger
Shaped notches Doughnut shapes
Tornadoes
Hail
Control
Radar Operation in Weather Mode
Operating Mode Weather Alert GWX Only
Bearing Line
Press the RNG keys to select the desired range
Displaying Weather on the Weather Radar
Not available with all radars
Vertically Scanning a Storm Cell
79 Bearing Line Adjustment
Adjusting the Antenna Tilt Angle
Adjusting Gain
Turn the small MFD knob to adjust the Tilt value
Adjusting Antenna Tilt on the Horizontal Scan Display
Restore Calibrated Gain
Turn the small MFD knob to adjust the Gain
Turn the small MFD knob to select FULL, 60, 40, or 20 scan
Sector Scan GWX Radars Only
Weather Attenuated Color Highlight Watch
Antenna Stabilization
GWX Radars Only
Weather Alerts
Weather Alert GWX Radars Only
Ground Target Return Intensity Levels
Ground Mapping and Interpretation
100
90 Ground Radar Operation Caution
Press the Mode soft key
91 Select Gfds Weather
Gfds Weather Optional
Register With Gfds
Gfds Registration
Deactivate Unit Registration With Gfds
94 Gfds Registration Page Default and Completed
Customizing the Gfds Weather Map
Using Gfds Satellite Weather Products
96 Weather Data Link Setup Menu Options
98 Weather Page Map Orientation
24 Gfds Weather Page Menu Setup Options
99 Select Gfds Data Request
Gfds Data Request
Flight Plan Gfds Data Request
Gfds Data Request Coverage
Present Position Gfds Data Request
Destination Gfds Data Request
Waypoint Gfds Data Request
Turn the large MFD knob to highlight Waypoint. Press ENT
Diameter/Route Width Gfds Data Request
Gfds Data Request Auto Request
Gfds Data Request Status Window
Gfds Data Request Manual Request
Precipitation Precip Data Viewing Range
Turn the large MFD knob to highlight Precip Legend
Precip Legend
109 Gfds Infrared Satellite Data Map Display and Legend
Gfds Infrared Satellite IR SAT Data Viewing Range
110 Gfds IR SAT Viewing Range Selection
IR SAT Data Viewing Range
111 Gfds Data Link Lightning and Legend
Range
112 Gfds Lightning Viewing Range Selection
Data Link Lightning Data Viewing Range
Localized Sigmet Icing Sigmet Line
SIGMETs and AIRMETs SIG/AIR
114 Gfds Weather AIRMETs/SIGMETs Detail and Legend
115 Gfds SIG/AIR Viewing Range Selection
Turn the large MFD knob to highlight SIG/AIR Viewing Range
116 Gfds Weather Graphic METARs and Legend
Cursor Location Product Age Selected Metar VFR
117 Metar Viewing Range Selection
118 Gfds Weather Winds Aloft
120 Winds Aloft Data Viewing Range Selection
121 Winds Aloft Altitude Selection
ChartView and FliteCharts electronic charts
Additional Features Optional
ChartView Chart
Viewing Charts
Vertical Scroll Bar Horizontal Scroll Bar
Chart Panning
Choosing a Chart for the Current Airport
Selected Chart for the Current Airport ChartView shown
Press ENT to accept and view the selected chart
Airport Identifier Selection
Selecting a Chart by Identifier
Charts Menu Selections
Selecting a New Chart by FPL, NRST, or
Barometric Minimums Source Selection
5.3 Day/Night View
Viewing Chart NOTAMs
Chart NOTAMs
ChartView Optional
Cycle Number and Revision
Effectivity
System is verifying chart
Installed for the first time
Power-up Page Annunciations and Definitions
Viewing Chart Details in ChartView
14 Detail of the Selected Chart Header Shown
Press the Back key to return to the view of the full chart
FliteCharts
For the FliteCharts
Is not configured for
FliteCharts. Contact a
Database is installed
Taxiway Identification Hot Spot Outline
SafeTaxi
Dcltr Soft Key Removes Taxiway Markings
Decluttering
Using SafeTaxi
Hot Spot Information
Spot Hot
SafeTaxi Cycle Number and Revision
Border Name
SafeTaxi Database Not Available
SafeTaxi Database is Current
XM Radio Entertainment
Activating XM Satellite Radio Services
190-00601-02 Rev. E Garmin G600 Pilot’s Guide
18 XM Information
XM Information
XM Entertainment Radio
Turn the large MFD knob to Aux Mode
20 XM Category List
Channel Categories
22 XM Channel Selection
Selecting an XM Radio Channel
Volume Bar Graph Volume Soft Key Label
XM Radio Volume
Volume Bar Graph Volume Soft Key Labels
Press and hold a preset soft key, such as PS1
XM Radio Channel Presets
GDL 69 Status OK LRU Info Window
GDL 69/69A Data Link Receiver Troubleshooting
Autopilot Test
Autopilot Operation
Autopilot Disconnect
Altitude Capture Optional Interface
Heading
Selected Heading Box
Autopilot Operation with Gpss Enabled Autopilots
Engage your autopilot in Gpss navigation mode
Autopilot Navigation
Autopilot Operation with the GDU 620 Emulating Gpss
Engage your autopilot in Heading mode
Heading Bug Inactive Indication
SVT Off SVT On
Flight Director Display
Synthetic Vision Technology Optional SVT
32 Synthetic Vision Imagery PFD
33 SVT Soft Keys
SVT Operation
Activating and Deactivating SVT
To enable SVT
Flight Path Marker FPM
SVT Features
3.2 Zero-Pitch Line
Airport Signs
Horizon Heading
Horizon Heading
39 Depiction of Runway with a Loaded Flightplan
Runway Depiction
42 Traffic Depiction on PFD and MFD
Traffic on PFD Traffic on MFD
Obstacle Alert
Obstacles
Obstacles Obstacle Pop-Up
Shaped Lines Depict PFD Field of View angle is approx
Field of View
To configure the Field of View
Press the ENT key to bring up the setup
Field of View
Blue Band Sky Representation
Unusual Attitudes
50 Blue Sky Bar with Full Display Terrain
49 Unusual Attitude Display Brown Band
Alerts
Reset your settings
ALT key is ALT key is not available Disabled
Available Service
Module is Service Inoperative
GAD
Integrity fault Service
Invalid Fault Service
Range Fault Service
Time-out Fault Service
Based mode
GPS 1/2 is lost Service
Config service Service Required
HDG features
Mismatch Service Communication Halted
Power usage by
Service. Contact
Where LRU
NAV1/2
Possible severe Check weather radar Weather ahead
System
GPS track
Track
System Status
System Status
This page intentionally left blank
Map Page Symbols
Other Traffic
SafeTaxi Symbols
Traffic Symbols
Proximate Advisory PA
Obstacle Altitude/Color Correlation
Terrain Obstacle Symbols
Traffic Enabled and Available Indicator
Basemap Symbols
Map Tool Bar Symbols
Indicator
XM Weather Tool Bar Symbols
XM Weather Tool Bar Symbols
Cloud Top Cloud Top and Echo Top Mutually Exclusive
Miscellaneous Symbols
Course Deviation Indicator
Attitude Direction Indicator
Automatic Terminal Information Service
Barometric setting
Error
Default
Departure Procedure
Disabled
Heading
FAA FCC Fcst
Lifr Lnav LOC LOI LON LPV LRU Ltng
Leg
Quantity
Outside Air Temperature Omni Bearing Selector
Minimum Safe Altitude
Minimum
System True Traffic Advisory
Standard Terminal Arrival Route statistics
Traffic Advisory System
WPT
Vspeed
XTK
Database List
SD Card Use and Databases
Updating the Jeppesen Database
Jeppesen Databases
Figure A-2 Database Loading Completed
Power down the GDU
Garmin Databases
Updating Garmin Databases
Navigation Database SD Update Card
Figure A-5 Database Information on the Splash Screen
Index
Symbols
Bearing line 2-27, 4-94, 4-97
GSR 56 1-5, 3-66, 3-69 GTP 59
ILS
Nav Status Bar
Tacan
Vortac
XM radio volume
Page
#05-06 Eastgate