Figures
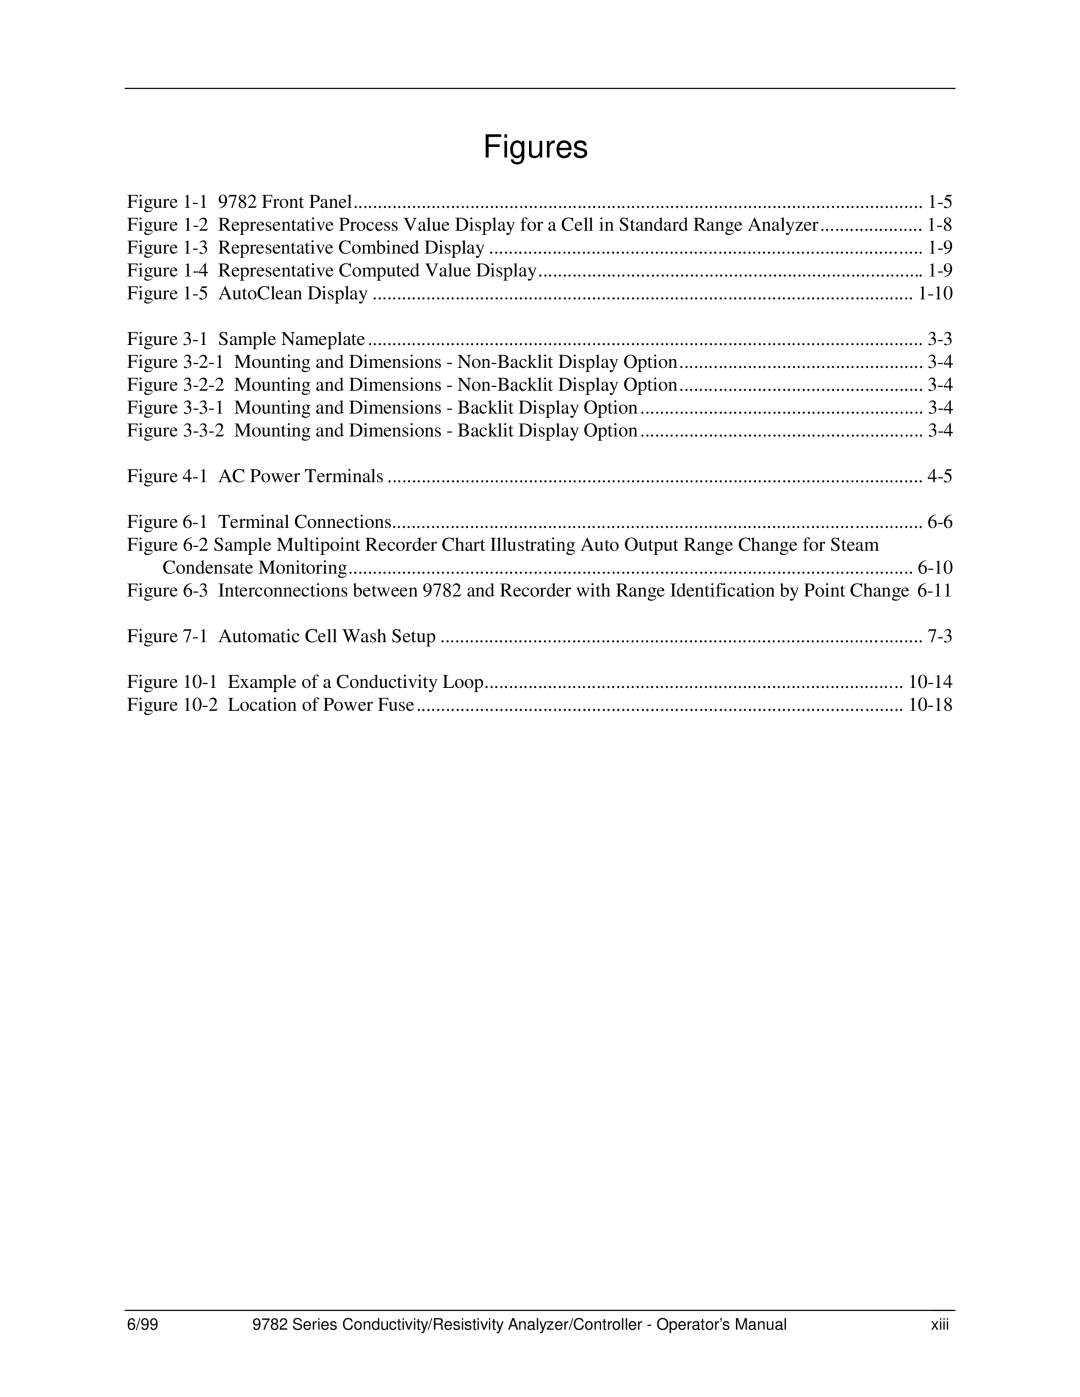
Figure | 9782 Front Panel | ||
Figure | Representative Process Value Display for a Cell in Standard Range Analyzer | ||
Figure | Representative Combined Display | ||
Figure | Representative Computed Value Display | ||
Figure | |||
Figure | |||
Figure | |||
Figure | |||
Figure | Mounting and Dimensions - Backlit Display Option | ||
Figure | Mounting and Dimensions - Backlit Display Option | ||
Figure | |||
Figure | Terminal Connections | ||
Figure |
| ||
Condensate Monitoring | |||
Figure | Interconnections between 9782 and Recorder with Range Identification by Point Change | ||
Figure | |||
Figure |
| ||
Figure |
| ||
6/99 | 9782 Series Conductivity/Resistivity Analyzer/Controller - Operator’s Manual | xiii |
