IBM
Page
IBM
Ninth Edition May
Contents
Operational Modes and States, and Informational States
Operational Characteristics
Advanced Operating Procedures
Basic Operating Procedures
Pause
Problem Determination Procedures
Remote Library Manager Console Feature
Readers Comments Ð Wed Like to Hear from You
Appendix A. Keyboard Template
Figures
Magstar 3494 Tape Library Operator Guide
Figures
Xii Magstar 3494 Tape Library Operator Guide
Organization
Preface
3490E
Related Information
3590
AS/400
Risc System/6000
Additional
You can send us comments about this book electronically
Xviii Magstar 3494 Tape Library Operator Guide
Summary of Changes
Xx Magstar 3494 Tape Library Operator Guide
Introduction
IBM 3494 Tape Libraries
IBM 3494 Tape Libraries
Functional Components
Control Unit Frame Functional Components, 3490E Front View
„4… Picker
„3… Cartridge accessor
„1… Library manager
„2… Cartridge storage cells
Control Unit Frame Functional Components Rear View
„2… Rail system
Storage Frame Functional Components front
„2… Magnetic tape subsystems
„3… Power control compartment
„4… 3590 Model A00 or A50 Control Unit
„5… 3590 tape subsystems
Drive Unit Frame Functional Components rear
„5… Disk storage
„4… Virtual Tape Server controller
Model B16 Virtual Tape Server Functional Components rear
„2… Virtual Tape Server controller
„1… Disk storage
Model B18 Virtual Tape Server Functional Components rear
„2…Barrier door
Picker not visible
Hot standby accessor or second active accessor not visible
„2… Barrier door
„3…Hot standby library manager
Library Type Cartridge Capacity
Cartridge Input and Output Facilities
High-Capacity Output Facility
High-Capacity Input/Output Facility
Single-Cell Output Facility
Convenience Input¤Output Station Feature
Cartridge Tape
Cartridge System Tape Identication
Tape Cartridge Requirements
Cartridge System Tape Labels
Cartridge File Protection
Media-Type Cartridge Type Color Label Handled as
Cartridge System Tape Labels
Cartridge Labeling
Unlabeled Tape Facility
Cartridge Label Position
Media-Type Labeling
Row numbers
Cartridge Storage Cells
Wall number
Column letters
Reserved Cartridge Storage Cells
Cartridge Storage Capacity
Without Model or Frame Dual Gripper
Without Model or Frame Dual Gripper
Password-Protection
Library Manager
User Interface
Database
High Availability Model HA1
Database Information Available to a Host
Operational Modes and States
Magstar 3494 Tape Library Operator Guide
Controls and Indicators
Power Controls and Status Indicators
Motion Controls and Status Indicators
Operator Panel
Convenience Input¤Output Station Status Indicators
„5…Convenience Input/Output Station Operation Tab
„4… Input¤Output Locked
Message displays
Drive control
IM L
Tape Subsystem Controls for Model F1A
Model B1A Tape Subsystem Controls
Controls and Indicators for Model F1A
Model B18 Operator Panel
Power Controls
Model B18 Virtual Tape Server Controls
Model B16 Virtual Tape Server Controls
Magstar 3494 Tape Library Operator Guide
3490E/3590 Tape Subsystem Operation
Virtual Tape Server
Emulation of 3490-Type Tape Drives
Fast Response for Non-specic Mount Requests
Tape Volume Cache
Storage Management of the Tape Volume Cache
Maintaining Data Fragments from Copied Volumes
Scratch Stacked Volumes
Deletion of VTS Logical Volume
Integration with the 3494 Library
Logical Library Partitioning
Scsi Host Attachment
VTS Import/Export Overview
Logical Volume Inventory
Local and Remote Power Control
Operator Interface
Operator Involvement
System Administrator Involvement
Inventory Update
Error Detection and Reporting
Category Hex Name Denition
Volume Categories
FF0F
Via the Manage Unassigned Volumes panel, shown
Is completed. The Manage Export Hold Volumes
Category Hex Name Denition
FFF8
Physical Volume States
Logical Volume States
Physical Volser Validity Checking
Logical Volser Validity Checking
Command Priorities in the Queue
Priority Levels
Priority Operations Promotable
Operations
Host-Initiated Operations
Mount Operations
Physical Mount Required
Demount Operations
Eject Operations
Audit Operations
Stand-Alone Operations
Stand-alone restore
Export Operations
Import Operations
Initial Cartridge Installation
Stacked Volumes
Cartridge Placement
Initial Volume Inventory Upload
Actions to Avoid when Operating a
Things You Should Try to Avoid Doing
Things You Should Never Do
Operational Characteristics
Magstar 3494 Tape Library Operator Guide
Operational Modes
Auto Mode
Pause Mode
Manual Mode
On page 65 shows the screen for the standby Library Manager
Additional Operational Modes in the HA1 Environment
Fixed home cell
Home Cell Mode
Operational States
Library manager initialization
Online State
Library Manager Switchover in Progress
Accessor Switchover in Progress
Initialization complete
Degraded operation
Dual Active Accessor Status
Safety interlocks open
Informational States
Operational Mode Transitions
Pause Mode to Auto Mode
Relationship between Operational Modes and States
Auto Pending Pop-Up Window
Auto Mode to Pause Mode No Error
Pause Mode to Manual Mode
Manual Mode to Pause Mode
Auto Mode to Manual Mode
Operational State Transitions
Manual Mode to Auto Mode
Initialization State to Auto, Pause, or Manual Mode
Auto Mode to Pause Mode Forced
Online State to Offline State
Shutdown Pending State to Shutdown State
Shutdown State to Library Manager Initialization State
Offline State to Online State
Informational State Transitions
Safety interlock open
Initialization Complete State to Online or Offline State
Offline State to Shutdown Pending State
Library manager check-1 condition
Powering On
Powering Off
Task Procedure
Changing from Remote to Local Power
Changing to Pause Mode
Changing to Auto Mode
Changing from Local to Remote Power
Inserting Cartridges
Using Empty Cartridge Cells to Insert Cartridges
Convenience I/O Mode
Inserting Cartridges in the Convenience Input¤Output Station
Using the Convenience Input¤Output Station Import Mode
Native 3590 use
Removing Ejected Cartridges
Using the High-Capacity Input/Output Facility
Magstar 3494 Tape Library Operator Guide
Import category
Magstar 3494 Tape Library Operator Guide
Task Reference
Advanced Operating Procedures
ªManage Unassigned Volumesº on
ªSystem Administrator Passwordº on
Task Reference
Using the Library Manager
Operator Panel Controls
„1… System Menu Icon
„5… Vertical Scroll Bar
„2… Title Bar
„3… Window-Sizing Icons
„4… Sizeable-Window Border
„9… Push buttons
„6… Non-Sizeable Window Border
„7… Dialog or Message Box
„8… Horizontal Scroll Bar
„13… Action Bar
Making Library Manager Selections
Selections with the Keyboard
Selections with the Pointing Device
Pointing Device
Track Pointer Keyboard
Help for help
Using the Help Pull-Down
Keys help
Help Search
Help Action Bar and Function Keys
Extended help
F11 or Shift+F1
Services
Key Functions
Options
Page
Using the Operator Menu
Online
Using the Mode Pull-Down
Service menu
Manual
Pause
Auto
Online
Manual
Initial Mode/State Selection Pop-Up Window
Offline Request Pop-Up Window
Offline
Help
Service Menu
Cancel
Operator intervention
System Administrator Password Pop-Up Window
Switch Active Library Manager to Standby
Switch Active Accessor to Standby
Accessors
Disable Dual Active Accessors
Enable Dual Active Accessors
Shutdown
Lockup Library Manager
Shutdown Panel
Using the Status Pull-Down
VTS status
Accessor Mounts per Hour
Operational status
Component availability status
Operational Status
Magstar 3494 Tape Library Operator Guide
Advanced Operating Procedures
Not available
Indicates Disabled, Enabled, or Not installed
Disabled or Not Installed
Or Enabled
Refresh
Component Availability
Vision System
Cartridge Accessor
Convenience Input¤Output Station
Grippers
Part 2 of 3 Component Availability Status Pop-Up Window
Devices
Physical/Virtual Device Frame
VTS Status
Library Sequence Number
VTS Attachment Type
Performance Statistics
Part 1 of 2 Performance Statistics Pop-Up Window
Part 2 of 2 Performance Statistics Pop-Up Window
Shows the Accessor Mounts per Hour window
Accessor Mounts per Hour
VTS Active Data Pop-Up Window
VTS Active Data
Refresh
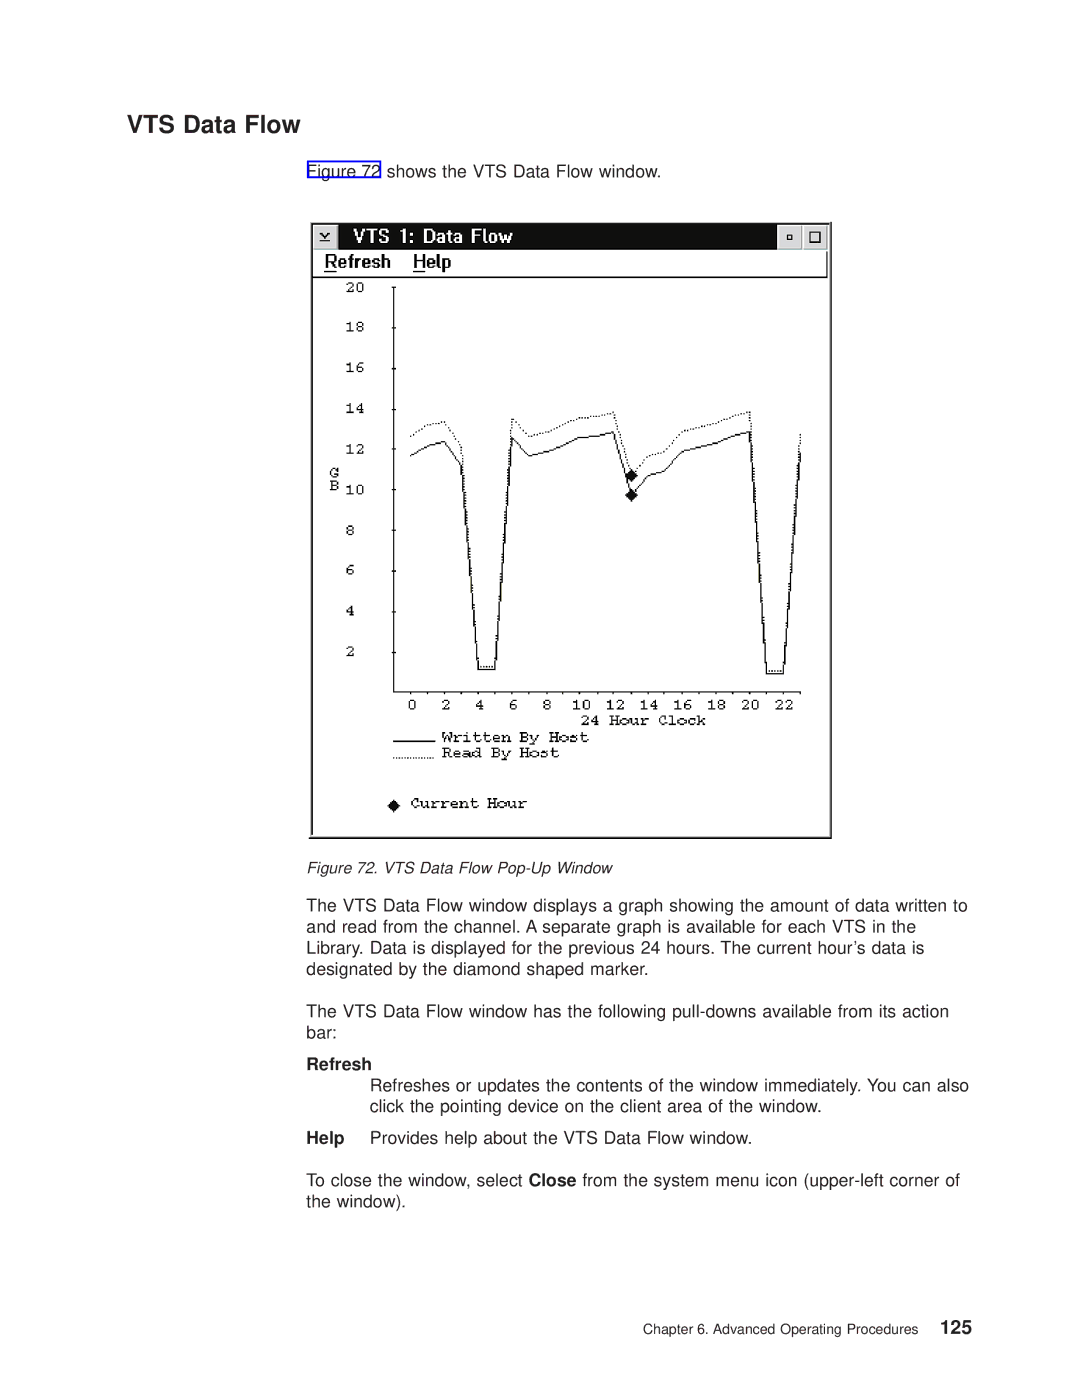
Shows the VTS Data Flow window
VTS Data Flow
Shows the VTS Mount Hit Data window
VTS Mount Hit Data
Refresh
Shows the VTS Physical Device Mount History window
VTS Physical Device Mount History
Shows the VTS Logical Mounts Per Hour window
VTS Logical Mounts Per Hour
Shows the VTS Active Data Distribution window
VTS Active Data Distribution
Using the System Summary
High Capacity Rack
Convenience I/O Mode
Inventory Update
High-Capacity Output or Input/Output Status
Gripper
Active Accessor
Standby Accessor
Accessor
Intervention
LAN Status
Host Alias
Host Name
Previously Initialized
Dual Accessor Zones
Using the Queues Pull-Down
Queued
Priority
Action
Device
Search Database For Volumes
Using the Database Pull-Down
Search Criteria
Media Type
FF15
FF16
FF17
Ignore
Search Results
Search
Yes
Displaying Search Results
Find Logical Volumes Home Pop-Up Window
Find Logical Volumes Home
Category Order
List Database Volumes
Specic Rack
Mount Date
Specic Media Type
Specic Category
Volser Mask
Operation could not be completed because the C Drive is full
Create list
Stacked Volume Map Pop-Up Window
Stacked Volume Map
Get Map
Using the Commands Pull-Down
Manage Import Volumes
Insert VTS logical volumes
Eject a VTS stacked volume
Manage Unassigned Volumes
Perform inventory update Partial
Disable inventory update
Enable inventory update
Perform inventory update Full
3490E or 3590 Device Cleaning
Schedule Cleaning
Clean Schedule Panel Controls
Cleaner Cartridge Replacement at End-of-Life
Days to clean
Clean based on time
Clean based on usage
Usage clean
Cleaner Cartridge Masks
Eject a Cleaner Cartridge
Send Message to Host Consoles
Cleaner Cartridge Masks
Host Message Pop-Up Window
Promote a Command in the Queue
Add/Modify range button
Volser Range for Media Types
Promote
Select Inserts
Add/Modify range
Range 1 and 2 entry elds
Media type list box
Volser ranges list box
Total volsers in range
Insert VTS Logical Volumes
Delete range
Volser in range?
VTS Library Selection
Media type radio buttons
Insert VTS Logical Volumes Status
Eject a VTS Stacked Volume
Cancel insert operation
Set VTS Category Attributes
Eject a VTS Stacked Volume Pop-Up Window
Set VTS Management Policies
Add category
Delete category
Magstar 3494 Tape Library Operator Guide
Set VTS Management Policies Pop-Up Window
Inventory New Storage or Re-inventory Complete System
Select Reinventory Complete System and continue
Shows the Display VTS Export/Import Volumes Window
Set the Volser Range
Save Logical Volumes
Inventory Cleaner Masks Pop-Up Window
Cleaner Volume Masks
Cancel inventory
Inventory Status
Start inventory
Re-Inventory with Virtual Tape Servers
On page 175 shows the Service Pull-Down Menu
On page 176 shows the VTS Online/Offline Pop-Up Window
VTS Online/Offline Pop-Up Window
Disable Inventory Update
Perform Inventory Update Full
Enable Inventory Update
Pop-up window contains the following messages
Perform inventory update
Perform Inventory Update Partial
Stand-Alone Device
Setup Stand-Alone Device
Mount from Input Station
Mount a single volume
Demount a single volume
Enter device
Reset Stand-Alone Device
ICL mode
Stand-Alone Device Status
Device category
Insert Unlabeled Cartridges
Add LAN Host
Communication Protocol
AS/400
Risc System/6000
90765 SP2
Host Transaction Program Name
Ethernet Format Check Box
Host Network ID
Host Location Name
Host Adapter Address
Add LAN Host to Library Pop-Up Window APPC/VTAM Selected
Host Alias optional
Physical Unit Name
Host IP Address
Delete LAN Host
Delete LAN Host from Library Pop-Up Window
Update LAN Host Information
Update LAN Host Information Pop-Up Window
Change LAN Host Information Pop-Up Window Appc
XID optional
USIBMSU.S10A4045, then the Host Network ID is Usibmsu
Ethernet Format Check Box
Change LAN Host Information Pop-Up Window TCP/IP
Library Location Name
LM LAN Information
Library Transaction Program Name
Library Network ID
Library Name
Operator Intervention
Library Adapter Address
Library IP Address
Send interventions to host consoles
System Administrator Password
New password
Current password
Manage Unassigned Volumes
Managing Import/Export Volumes
Volser Ranges
Manage Import Volumes Pop-Up Window
Manage Import Volumes
Manage Insert Volumes Pop-Up Window
Manage Insert Volumes
Export-Hold
Manage Export-Hold Volumes
Cancel Export/Import Pop-Up Window
Cancel Export/Import
Snmp Options
Service Access
Selecting Snmp Trap Types
Using the Library Managers Snmp Features
Select Snmp Trap Types Pop-Up Window
Conguring Snmp Trap Destinations
Adding a Destination
Stopping Snmp
Starting Snmp
Trouble Shooting
Receiving Snmpd Traps on the Monitor Station
Sending Testm Messages
Rest of Message
Outline for Receiving Library Manager Snmp Traps
Library Manager Trap Type
Trap Number
Opint Library Manager Snmp Traps
Programming Tools
Parameter Actual Library Manager Opint Trap
Rack Cell
External
Internal
High-capacity input rack cell B
Ejected to the high-capacity output station
VTS
VTS is out of stacked volumes
Parameter a
Unsol Library Manager Snmp Traps
Category State Change Snmp Trap
Library Manager Operator Message Snmp Traps
Library I/O Station State Change Snmp Traps
Check1
Safety Enclosure Interlock Open
Out of Cleaners
Operational State Change Snmp Traps
Message
Volume Exception Snmp Traps
Smoke Detected
Exception Code
Device Category Change Notication Snmp Traps
Device Availability Changed Snmp Traps
Testm Library Manager Snmp Traps
Using the Options Pull-Down
Errorcode
CHCK1 Library Manager Snmp Traps
Using Manual Mode
Clean desktop
Change power-on language
Starting Manual Mode
Manual Pending Wait Message
Mount WCC007 Rack
Operating in Manual Mode
Using the Drive Message Display
Mounting Cartridges
Arrows
Demounting Cartridges
Using the Action List Screen
Enter
F12
Ejecting Cartridges
Reviewing Unknown Volume Locations
Manual Mode Review List Screen
Error Processing
Volser
Locating and Identifying Home Cell Locations
Manual Mode Locate Cartridge Home Screen
Ending Manual Mode
Cartridge Removal from the Gripper
Cartridge Removal from the Gripper
Using the Keyboard Template
Remote Library Manager Console Feature
Starting Dcaf on the Remote Library Manager Console
Installing and Conguring
Dcaf Controlling Main Window
Dcaf Target Password
Establishing Communication with the Library Manager
Session
Keystrokes
Keystrokes Local Mode on the Remote Library Manager Console
Changing Keystrokes Mode
Using Hot-Key Combinations
Sending the Alt+Esc Command to the Library Manager
Sending the Alt+Tab Command to the Library Manager
Sending the Ctrl+Esc Command to the Library Manager
Active Ctrl+A Monitor Ctrl+M Suspend Ctrl+S Terminate Ctrl+T
Session State Description
Using the Pointing Device during a Session
Remote Library Manager Console Session Window
Moving Among Multiple Sessions
Transferring Files
Changing the Session State of the Library Manager
Established
Active Session
Changing the Password from the Library Manager
Session Pull-down Menu
Symptom Description and Possible Solution
Magstar 3494 Tape Library Operator Guide
Conditions Reference
Quick Reference Table to Problem Determination Procedures
Failure and Exception Condition Reporting
Library Manager Failure in a DFSMS/MVS Environment
Library Manager Failure Recovery Procedures
Host Messages DFSMS/MVS Environment
Library Manager Screens DFSMS/MVS Environment
DFSMS/MVS Environment
Library Manager Action ± The Library Manager Recovers
Vary SMS, LIBlibname1, Online
Dfsms Host Action
Vary xxx, Online
Library Manager Failure in an MVS/BTLS Environment
Host Messages MVS/BLTS Environment
Library DISPDRV, libname1
Library Manager Screens MVS/BLTS Environment
Recovers MVS/BLTS Environmentº
Btls Host Action
Dfsms System Managed Tape Messages
Volume volser. Library error code=error-code
CBR3721I Library library-namein manual mode
CBR3724I Volume volser does not exist in library
CBR3725I Library library-namecommand reject for
From library library-namefor volume volser
Is now available
CBR3751E Device device-numberin library
Library-nameis unavailable
CBR3752I Device device-numberin library library-name
Paused
Mode operational state
Manual mode
CBR3757E Library library-namein paused/manual
Operational
Library-namein paused mode operational state,
Interlock open
CBR3760E Library library-namevision system not
CBR3770I Volume volser misplaced in library
CBR3765E No cleaner volumes available in library
CBR3766E Dual write disabled in library library-name
CBR3769I Misplaced volume volser found in library
Library library-name
CBR3774I Unexpected volume volser ejected from
CBR3776I Volume volser inaccessible in library
CBR3777I Volume volser now accessible in library
Information Provided at the Library Manager Console
Table for System Summary Window Problem Determination
Using the System Summary Window
Field Name Action LAN Attach Ports
Convenience I/O Mode
Inventory Update
Accessor
Using the Search Database for Volumes Window
Using the Component Availability Status Window
Message
Specic Misplaced Volume
Problem Scenario Action Specic Inaccessible Volume
Using the Whole Queue Window
Intervention Required Conditions and Actions
In-Progress
Condition Type Table Location
Quick Reference Table to Intervention Required Conditions
Table for Intervention Conditions of Library Tape Drives
Message
Probable Cause
Gripper conguration has changed. The library
Device xxx has failed. a service call is needed
Cartridge could not be released from gripper
Gripper failure on gripper
Table for Intervention Conditions of Input/Output Stations
Volser xxxxxx cannot be removed from
Top two I/O station cells are inaccessible. Move
Convenience I/O station should be empty but is
Not, visually check the station
Facility cell yyyy
Duplicate volser xxxxxx was ejected to
Duplicate volser xxxxxx was left
Duplicate volser xxxxxx was left in high-capacity
Cell yyyy
An unreadable volser was left in the convenience I/O
Station
An unreadable volser was left in high-capacity facility
Cartridge or cartridge label located at cell yyyy is
An unexpected volser xxxxxx was found
Ejected to the convenience I/O station
Ejected to high-capacity facility cell yyyy
Been ejected to high-capacity facility cell yyyy
An invalid media volser xxxxxx has been ejected to
High-capacity facility
Damaged volser xxxxxx ejected to the convenience
Table for Intervention Conditions of Data Cartridges
Cartridge containing invalid media has been left
Device xxx feed slot
Table for Intervention Conditions of Cleaner Cartridges
Mislabeled cleaner cartridge has been ejected to
Library is out of Hpct cleaner cartridges
Xxx feed slot. Remove the cartridge
Mislabeled cleaner cartridge has been left in device
To the convenience I/O station. VTS z
Intervention Required Condition Resolution Actions Message
Damaged stacked volume xxxxxx has been ejected
Virtual Tape Server is out of stacked volumes. VTS
Ejected to the convenience I/O station. Internal
Stacked volume has a label mismatch and has been
Orphaned logical volume xxxxxx found
Tape Volume Cache is degraded Error Code
Free storage threshold has been crossed. VTS z
During the disaster recovery process, a stacked
Volume xxxxxx and has been ejected. VTS z
Virtual Tape System z has a CHECK1 xxxx failure
Contact your service representative
Message Contact your service representative
Device xxx made unavailable by a VTS. VTS z
Mount of logical volume xxxxxx failed because
Physical volume yyyyyy is misplaced. rc=rrrr VTS z
Physical volume yyyyyy is inaccessible. rc=rrrr VTS
Volume yyyyyy failed. rc=rrrr VTS z
Mount of logical volume xxxxxx failed because
Physical volume yyyyyy is not in the library. rc=rrrr
Mount of logical volume xxxxxx located on physical
Virtual Tape Server Recovery Actions
Problem Determination Procedures
Magstar 3494 Tape Library Operator Guide
Appendix A. Keyboard Template
M m o n l y u s e d k e y s
Export List Volume
Import and Export List Volumes Format
Volume Contents Description
Bytes Description Use
Length Name Description
Name Description
Bytes Name Description
Bytes Name Description
Export and Import Status File Record
Bytes Description Use
EOF1
Import List Volume
Name Description
Characters are required
Status Text
Operation Status Resolution Actions Status Code
Operation Status Resolution Actions Status Code
Status Text
Probable Cause
Locate the Exported Stacked Volume needed
Call an IBM Service Representative
Determine why the specied volume is a duplicate
Suspected media failure, call an IBM Service
Detected the internal error
Check intervention required messages on the library
Nnnnn
Exported Stacked Volume processing error
Necessary to change the container volume to Blanks
Import and Export Messages from Library
Bytes 0±4
Byte
Bytes 6±69
Message Code Message Text
ALL Export Processing has Completed
Copying Logical Export Volumes from Cache to Stacked Volumes
Import Status Messages
Message Code Message Text
Export/Import List Volumes Failure-Reason Text
Volume Volser unable to locate Import List
Volume Volser could not be rewound
Volume Volser could not be closed
Volume Volser , unable to locate Export List
File Record, compacted
File Record, error converting Field
File, internal processing error Mmmm
File Record, unexpected End of Tape
Resultant Library Action
Category Recovery
Error Scenario Recovery Actions
Error Scenario
Reuse of Exported Stacked Volumes
Magstar 3494 Tape Library Operator Guide
Following terms are trademarks of other companies
Trademarks
European Union EU Electromagnetic Compatibility Directive
Communications Statements Federal Commission FCC Statement
Industry Canada Compliance Statement
Avis de Conformité aux Normes dIndustrie Canada
Hinweis
Laser Safety and Compliance
Safety Characteristics
Operator Safety
Bar-code reader. See vision system
Glossary
Enhanced Capacity Cartridge System Tape
Exported Stacked Volume. a physical volume
Glossary
Rack. See wall
Transient mount. See mount from input station
Volume. See cartridge
Virtual telecommunications access method Vtam
Index Numerics
159
Relationship between modes and states
States
Index
Magstar 3494 Tape Library Operator Guide
Please tell us how we can improve this book
How satised are you that the information in this book is
Business Reply Mail
Page
Ibmr