Groups Views
Custom 1, 2, 3 These field can be used to save information about this hardware to be used in logs, views and reports.
Events Details
From this screen you are able to add a comment to an event, set an event as acknowledged or not, or delete the event from the database. By managing events on your network you will be able to view the events that are critical and deal with those events first.
Click on the Events tab to see the list of events associated with this device.
At the top of the screen there is a total of the number of events for each event severity.
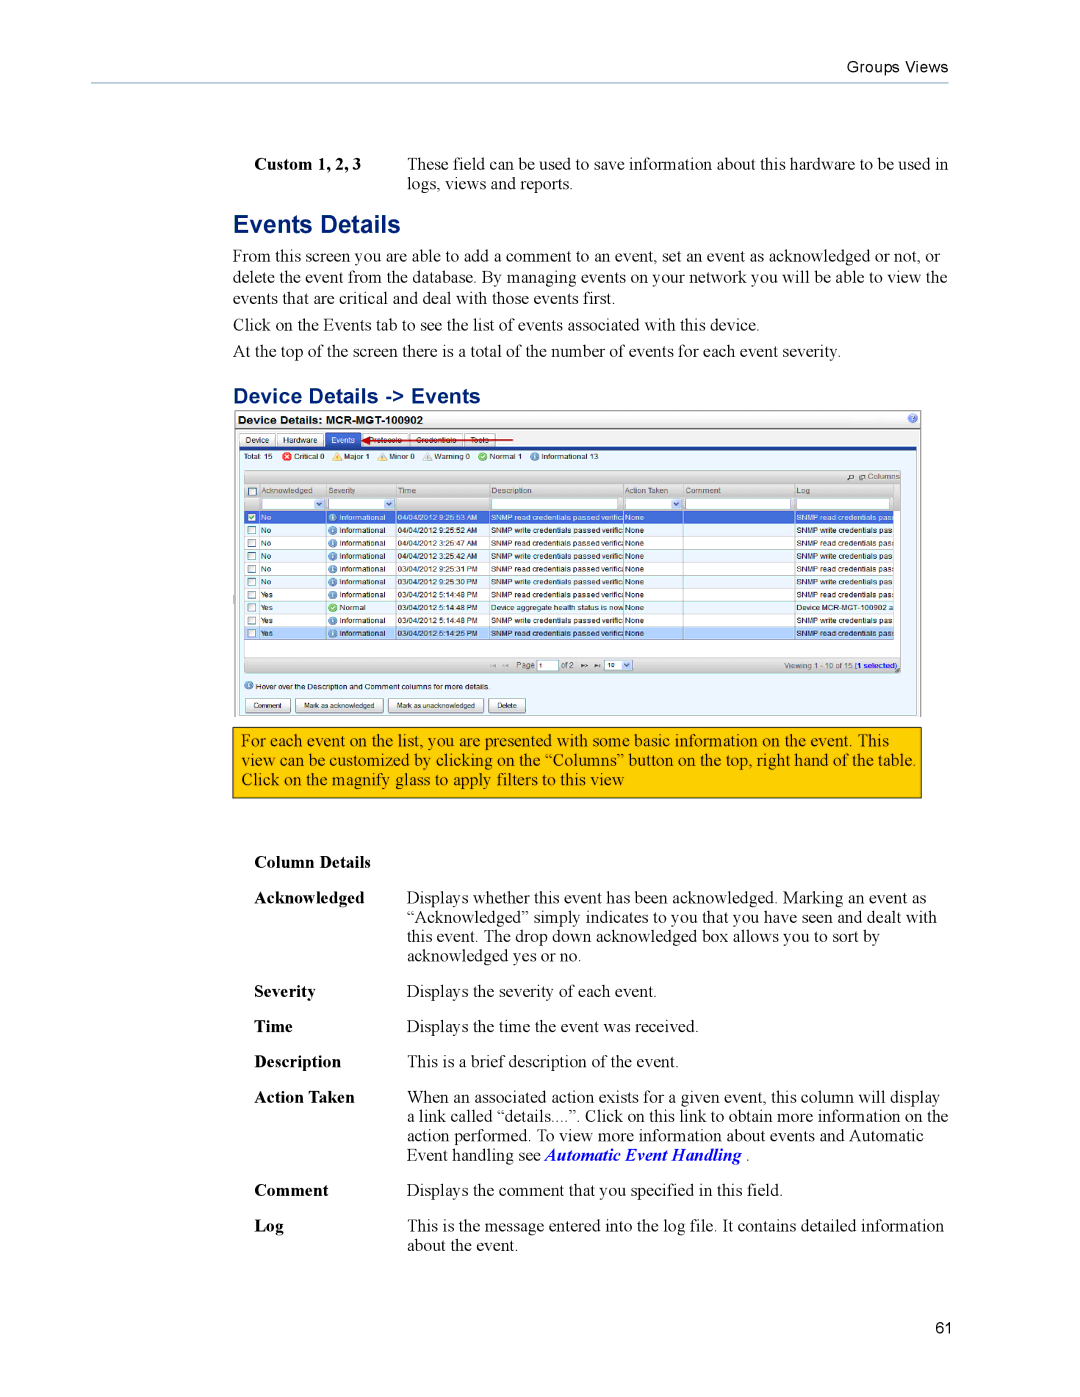
Device Details -> Events
For each event on the list, you are presented with some basic information on the event. This view can be customized by clicking on the “Columns” button on the top, right hand of the table. Click on the magnify glass to apply filters to this view
Column Details |
|
Acknowledged | Displays whether this event has been acknowledged. Marking an event as |
| “Acknowledged” simply indicates to you that you have seen and dealt with |
| this event. The drop down acknowledged box allows you to sort by |
| acknowledged yes or no. |
Severity | Displays the severity of each event. |
Time | Displays the time the event was received. |
Description | This is a brief description of the event. |
Action Taken | When an associated action exists for a given event, this column will display |
| a link called “details....”. Click on this link to obtain more information on the |
| action performed. To view more information about events and Automatic |
| Event handling see Automatic Event Handling . |
Comment | Displays the comment that you specified in this field. |
Log | This is the message entered into the log file. It contains detailed information |
| about the event. |
61