3-31 Section 3 - Operation
Electronic Instrument Cluster - EIC
Bar Graph Displays (LCD)
The four bar graphs each consist of twenty LCD segments..
All bar graph sensors are continuously tested for faults.. If a fault occurs, the bar graph will flash and a fault code will be stored..
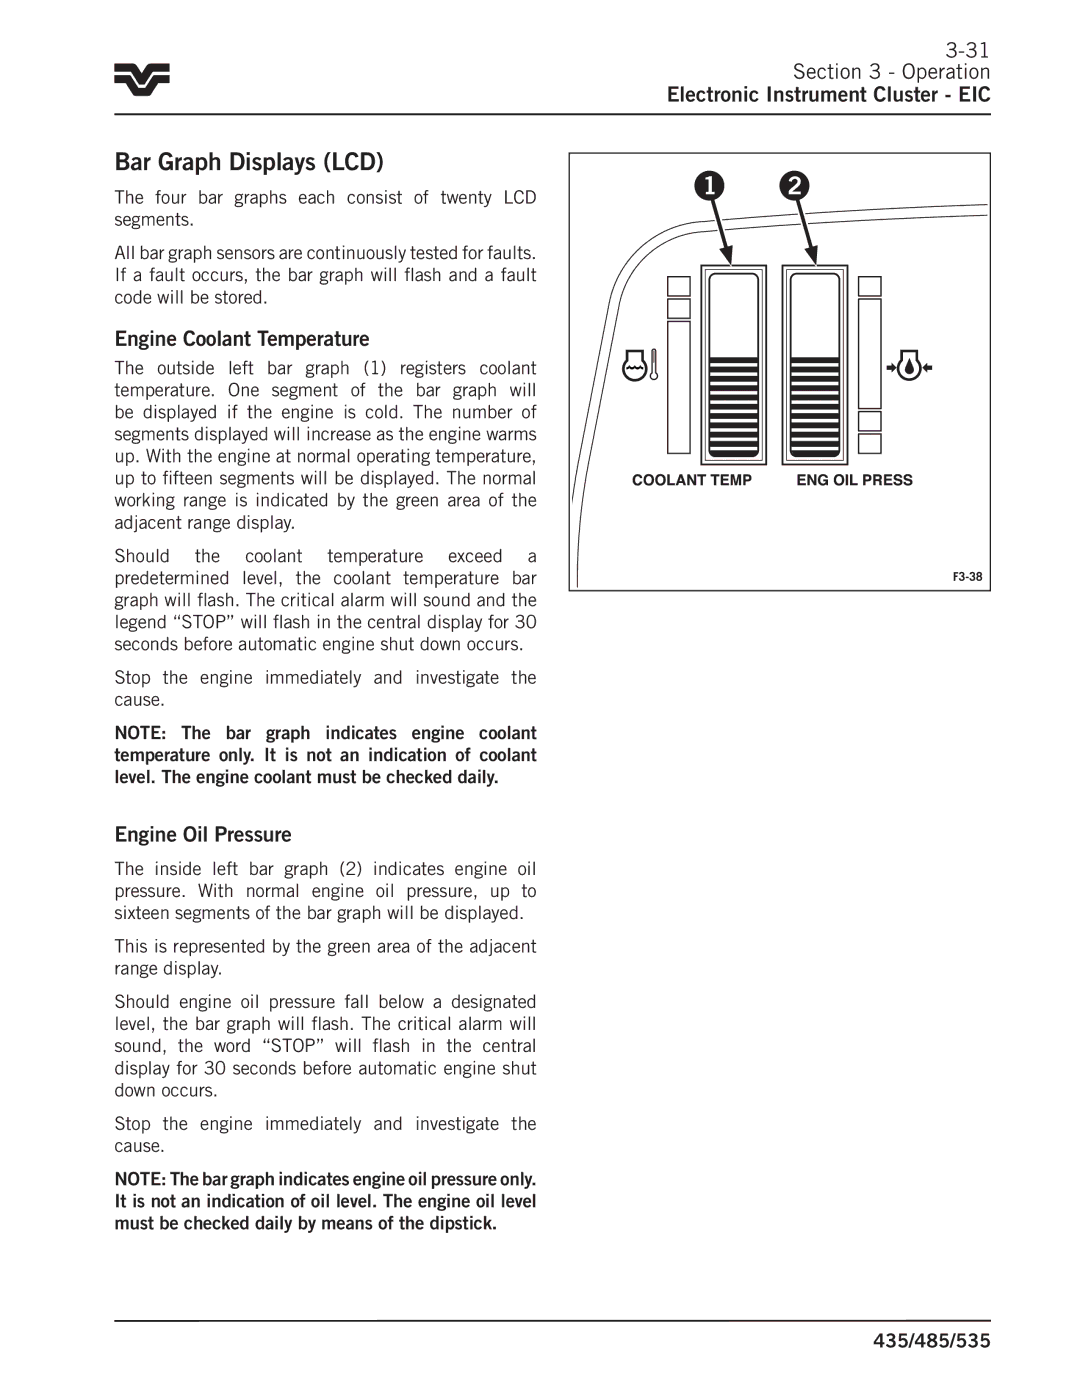
Engine Coolant Temperature
The outside left bar graph (1) registers coolant temperature.. One segment of the bar graph will be displayed if the engine is cold.. The number of segments displayed will increase as the engine warms up.. With the engine at normal operating temperature, up to fifteen segments will be displayed.. The normal working range is indicated by the green area of the adjacent range display..
Should the coolant temperature exceed a predetermined level, the coolant temperature bar graph will flash.. The critical alarm will sound and the legend “STOP” will flash in the central display for 30 seconds before automatic engine shut down occurs..
Stop the engine immediately and investigate the cause..
NOTE: The bar graph indicates engine coolant temperature only. It is not an indication of coolant level. The engine coolant must be checked daily.
Engine Oil Pressure
The inside left bar graph (2) indicates engine oil pressure.. With normal engine oil pressure, up to sixteen segments of the bar graph will be displayed..
This is represented by the green area of the adjacent range display..
Should engine oil pressure fall below a designated level, the bar graph will flash.. The critical alarm will sound, the word “STOP” will flash in the central display for 30 seconds before automatic engine shut down occurs..
Stop the engine immediately and investigate the cause..
NOTE: The bar graph indicates engine oil pressure only. It is not an indication of oil level. The engine oil level must be checked daily by means of the dipstick.
1 | 2 |