Ow INURFg k D
Fo Y b kr
C C v h
Page
No Changes
Scan
Use the Menu to
Yh R
Fo Y k Zy y Yh AFD7P HS y Yy y Y y y
Ks GHPDEc FDe c p
∙ d
Ks GHPDHc H w p
Ks GHPDGc FDe Ci
Ks GHPDICLc feh p
Ks GHPDOc HDe vg
Ks GHPDMc p p
∙ d BHE8
Hs r
F7o r8 Fo Delhax 6 8 a Express Exchange
Contents
Contents
Contents
Contents
Page
Shift w
User’s Guide5 Service Guide5 Quick Reference Guide5
To install the software, see
To Prepare the Instrument for Use
Instrument does not turn on properly, see
Installing HP BenchLink Data Logger Software
Settings Control Panel
Add/Remove Programs Install/Uninstall
File Run fww xw \setup
0H1
To Connect Wiring to a Module
Wzw
Ml lil l
To Set the Time and Date
To Configure a Channel for Scanning
Jyw
877
Qw z wz zyw Ww yw Yz yw wy
To Copy a Channel Configuration
$6772
To Close a Channel
Yzz Z3 w wwz yz w yw3 ywz w zw wz Zz yw z w w3 w
If the Instrument Does Not Turn On
Hq FGPN8a t g
Upt
9AN w 9A8 w
Zwx 4 y Yy ww
To Adjust the Carrying Handle
Bench-top viewing positions
To Rack Mount the Instrument
Quick Start
Page
Page
Front-Panel Menu Reference
X xz Zx x
Configure system-related instrument parameters
To Monitor a Single Channel
1759$/6&$1
To Set a Scan Interval
$%/$6/%6
To Apply Mx+B Scaling to Measurements
To Configure Alarm Limits
+ ,$/$5021
To Configure Alarm Limits
To Read a Digital Input Port
Ty H
7 h k
To Write to a Digital Output Port
$567
To Read the Totalizer Count
To Output a DC Voltage
To Configure the Remote Interface
+3,%
91,%,76
+$1*6$9
To Store the Instrument State
Page
Computer System
Data Acquisition System Overview
Advantages Disadvantages
Fo Y k 4yx Wg AFD7O Xx x AFD7O Sdd5 l Xz x x
HP BenchLink Data Logger
STcaLm p
EFC
Signal Routing
Model Number Module Name Common Uses
System Cabling and Connections starting on
Cable Type Common Uses Comments
Kxz zx x z Kzx Z3 x z x R3 U3 b5
Signal Routing and Switching
Relay Cycle Count on
HD8
N7v 2rc3 l
S7v l
D7v
X zzx 87 dW X x zx3 Y z z y5
Measurement Input
Sdd’s signal-conditioning
OSR5
Scan Count
GND
BWa3
HL8
Y zx Xx5 p zx x x z x x zx x z5
Control Output
HH8
FB W 2 bWa
ELI
Features and Functions
Features and Functions
Scpi Language Conventions
Scpi Language Conventions
Scanning
Scanning
Scanning
Scanning
Power Fails
Scanning
Fxx xx tz tzx 978 vt Yt z xx
Scan Count
Select the interval timer configuration
Set the scan interval to 5 seconds
Sweep the scan list 2 times
Initiate the scan
∙ Front-Panel Operation
Select the bus once configuration
Group Execute Trigger
Select the external trigger configuration
Ext Trig Connector
See Scan Count on page 86 for more information
Sx wxt vyzz tw z ttxyx Alarm Limits starting on
On page 86 for more information
Fxxv x ttvzt
Fxxx vt 9
Ex tt Mt
Fxxv tx
Sctxt
∙ exx Vxytvx bxt
Scanning
CH Delay Time
Range Channel Delay
Integration Time Channel Delay
AC Filter Channel Delay
∙ Sctxt
Readings
Twz vtx
Gt zzxw
Ttwz vtx
Aux twz x vtx
Single-Channel Monitoring
Single-Channel Monitoring
ROUTMONDATA?
Scanning With External Instruments
Scanning With External Instruments
Scanning With External Instruments
Fxxv t t
Fxvx vtx twvx
Fx t t a xvw
Fxx t
General Measurement Configuration
General Measurement Configuration
Change the range setting
This is the 10 Vdc range, 51⁄2 digits are displayed
101
102
Integration Time Resolution Digits Bits
WX c
104
105
Temperature Measurement Configuration
Temperature Measurement Configuration
Temperature Measurement Configuration
Temperature , Thermocouple
109
MoX g
To connect an RTD to the module’s screw terminals, see
111
To connect a thermistor to the module’s screw terminals, see
∙ Remote Interface Operation You can use the MEASure? or
Voltage Measurement Configuration
Voltage Measurement Configuration
XW c
Mx wv tzx tx
UW f
Mx tv tzx tw tv
Resistance Measurement Configuration
Resistance Measurement Configuration
To connect resistances to the module’s screw terminals, see
Current Measurement Configuration
Current Measurement Configuration
Applies to ac current and ac voltage measurements only
117
Frequency Measurement Configuration
Frequency Measurement Configuration
Sensfreqranglow 3,@203 Select the slow timeout 3 Hz
Mx+B Scaling
Mx+B Scaling
Vy x x tx tux Xtx x
Strain Gage Measurements on
121
Alarm Limits
Alarm Limits
Ux yzx tz x y
Using the Alarm Output Lines on
Then, choose from the following alarm conditions
Alarm queue is cleared when you read the alarms 126
127
Alarms Connector
Oxt tt
Otz x y x x vtx x x vtzx
Oxt y tt
130
131
Calccompmask command decimal
Result no alarm generated
Pt tw y /wxvt 8=B0
Or result
Digital Input Operations
Digital Input Operations
Extw u
Extw
Mww 79 xtw t
Totalizer Operations
Totalizer Operations
136
137
Digital Output Operations
Digital Output Operations
DAC Output Operations
DAC Output Operations
X vxM Xx / PMO vt05
System-Related Operations
System-Related Operations
141
Vx z
Extw tx x
Turns on. See the Uc =EC7M fxvx Twx
Xt t z uxx
Exx Vxytvx bxt
Returns 0 if the self-test is successful or 1 if it fails
144
Fxx
Fxt Wx 83 8EEC
HEWLETT-PACKARD,34901A,0,X.X
System-Related Operations
148
NWkc f
Vtxx fOcV yx ytx5
Remote Interface Configuration
Remote Interface Configuration
BkcV U
151
KDC5
NDC5
Vt xx utw x ytx
3mnCDC5
Lt vx y vxw y y5
154
Calibration Overview
Calibration Overview
156
Hv w vwx
158
159
Factory Reset State
Factory Reset State
Instrument Preset State
Instrument Preset State
Multiplexer Module Default Settings
Multiplexer Module Default Settings
Module Overview
Module Overview
Sx xvyvt xtv 4w3 yx x x xv vt E5
HP 34901A 20-Channel Multiplexer
HP 34901A 20-Channel Multiplexer
Slot Number
Name Function Comments
HP 34902A 16-Channel Multiplexer
HP 34902A 16-Channel Multiplexer
167
HP 34903A 20-Channel Actuator
HP 34903A 20-Channel Actuator
169
HP 34904A 4x8 Matrix Switch
HP 34904A 4x8 Matrix Switch
Name Comments
HP 34905A/6A Dual 4-Channel RF Multiplexers
HP 34905A/6A Dual 4-Channel RF Multiplexers
173
HP 34907A Multifunction Module
HP 34907A Multifunction Module
Slot Number 100 200
Digital Input / Output
Totalizer
DAC Output
HP 34908A 40-Channel Single-Ended Multiplexer
HP 34908A 40-Channel Single-Ended Multiplexer
177
Remote Interface Reference
Remote Interface Reference
Scpi Command Summary
Scpi Command Summary
Eyy
Scpi Command Summary Scan Measurement Commands
Monitor Commands
Zz vz 99B
Zz vz 9C
Scpi Command Summary Scan Configuration Commands
Scpi Command Summary Scan Statistics Commands
Scan Memory Commands
Zz vz
Zz vz 9A
Scpi Command Summary Scanning With an External Instrument
Zz vz 9E
Scpi Command Summary Temperature Configuration Commands
Zz vz 98E
Scpi Command Summary Voltage Configuration Commands
Scpi Command Summary Resistance Configuration Commands
Scpi Command Summary Current Configuration Commands
Zz vz Kvy vz 98 vy Ud E78N zz z5
191
Scpi Command Summary Mx+B Scaling Commands
Scpi Command Summary Alarm Limit Commands
Totalizer Commands
Scpi Command Summary Digital Input Commands
Zz vz 9AB
Scpi Command Summary Digital Output Commands
DAC Output Commands
Switch Control Commands
Zz vz 9AD
Scpi Command Summary Scan Triggering Commands
State Storage Commands
Zz vz 99D
Zz vz 9B8
Scpi Command Summary System-Related Commands
Zz vz 9B
Scpi Command Summary Interface Configuration Commands
Status System Commands
Zz vz 9BE
Zz vz 9DB
Service-Related Commands
Scpi Command Summary Calibration Commands
Zz vz 9E9
Scpi Command Summary Ieee 488.2 Common Commands
Simplified Programming Overview
Simplified Programming Overview
CONFigure zy yvz w
MEASure? v z vz
INITiate xy z vy 5 iz z
Xy z y zvy
Range 41⁄2 Digits
Gz z READ? xvy z z
Xv zy zyv w z FETCh? xv3 zxz z Vy vz zy vy z
205
V v zz vzy z
Xv3 ABORt x Qzxz Pzvzz vz
MEASure? and CONFigure Commands
MEASure? and CONFigure Commands
General Measurement Configuration starting on
MEASure? Command Syntax
MEASureTEMPerature? RTDFRTD,8591DEF
Yzz
MEASureVOLTageDC? MEASureVOLTageAC?
MINMAXDEF, @
MEASureRESistance? MEASureFRESistance?
MEASureCURRentDC? MEASureCURRentAC?
Pz vz vz vzy Xv 98 vy Ud E78N zz z5
MEASureFREQuency? MEASurePERiod?
MEASureTOTalize? READRRESet ,@
MEASureDIGitalBYTE? @
CONFigureTEMPerature TCouple,BEJKNRSTDEF Minmaxdef ,@t
MEASure? and CONFigure Commands CONFigure Command Syntax
CONFigureTEMPerature RTDFRTD,8591DEF
CONFigureVOLTageDC CONFigureVOLTageAC Autominmaxdef
CONFigureRESistance CONFigureFRESistance
CONFigureCURRentDC CONFigureCURRentAC
Pzzvzz vz vzy xv 98 vy Ud E78N zz z5
CONFigureFREQuency CONFigurePERiod Autominmaxdef
CONFigureDIGitalBYTE @
CONFigureTOTalize READRRESet ,@
CONFigure? @x
Setting the Function, Range, and Resolution
Setting the Function, Range, and Resolution
See also General Measurement Configuration in starting on
SENSeFUNCtion
SENSe VOLTageDCRANGe? @x
VOLTageACRANGe? @x
RESistanceRANGe? @x
FRESistanceRANGe? @x
SENSe VOLTageDCRESolution? @x
RESistanceRESolution? @x
FRESistanceRESolution? @x
CURRentDCRESolution? @x
SENSe VOLTageDCAPERture? @x
RESistanceAPERture? @x
FRESistanceAPERture? @x
CURRentDCAPERture? @x
SENSe TEMPerature
VOLTageDC
RESistance
FRESistance
Temperature Configuration Commands
General Temperature Commands
Temperature Configuration Commands Thermocouple Commands
SENSeTEMPeratureRJUNction? @x
Temperature Configuration Commands RTD Commands
Thermistor Commands
Voltage Configuration Commands
See also Voltage Measurement Configuration in starting on
INPut IMPedanceAUTO OFFON,@x IMPedanceAUTO? @x
SENSe Zeroauto OFFONCEON,@x ZEROAUTO? @x
Resistance Configuration Commands
Current Configuration Commands
Frequency Configuration Commands
Frequency Configuration Commands
See also Frequency Measurement Configuration in starting on
Scanning Overview
Scanning Overview
See also Scanning in starting on
Scanning Overview
Scanning Overview Scanning Commands
TRIGger SOURce BUSIMMediateEXTernalALARm1234TIMer SOURce?
ROUTe Scan @ SCAN?
ROUTeSCANSIZE?
TRIGger TIMer y Minmax TIMer?
ROUTe CHANnelDELay y
CHANnelDELay? @x
TRIGger COUNt x MINMAXINFinity COUNt?
ABORt
ROUTe CHANnelDELayAUTO OFFON,@x CHANnelDELayAUTO? @x
INITiate
FORMat READingALARm Offon READingALARm?
Scanning Overview Reading Format Commands
FORMat READingCHANnel Offon READingCHANnel?
FORMat READingTIME Offon READingTIME?
FORMat READingUNIT Offon READingUNIT?
FORMat READingTIMETYPE ABSoluteRELative READingTIMETYPE?
Hz vxz
Scanning Overview Scan Statistics Commands
CALCulateAVERageMINimum? @x
CALCulateAVERageMINimumTIME? @x
CALCulateAVERageMAXimum? @x
CALCulateAVERageAVERage? @x
CALCulateAVERagePTPeak? @x
CALCulateAVERageCOUNt? @x
CALCulateAVERageCLEar @x
DATAPOINts?
Scanning Overview Scan Memory Commands
DATAREMove? t
See Reading Format Commands on
SYSTemTIMESCAN?
FETCh?
? tx
Single-Channel Monitoring Overview
Single-Channel Monitoring Overview
ROUTe MONitorSTATe Offon MONitorSTATe?
ROUTe MONitor @xvz MONitor?
ROUTeMONitorDATA?
Scanning With an External Instrument
TRIGger SOURce BUSIMMediateEXTernalTIMer SOURce?
TRIGger COUNt z MINMAXINFinity COUNt?
Y z v Qaa ywy y Ud EC7N5
INSTrumentDMMINSTalled?
ROUTe CHANnelFWIRe Offon ,@x CHANnelFWIRe? @x
INSTrument
Mx+B Scaling Overview
Mx+B Scaling Overview
See also Mx+B Scaling in starting on
Mx+B Scaling Overview Mx+B Scaling Commands
CALCulate SCALeGAIN v ,@xt SCALeGAIN? @x
CALCulate SCALeOFFSet ,@xt SCALeOFFSet? @x
CALCulate SCALeUNIT zyt SCALeUNIT? @x
CALCulateSCALeOFFSetNULL @x
CALCulate SCALeSTATe OFFON,@x SCALeSTATe? @x
Alarm System Overview
Alarm System Overview
See also Alarm Limits in starting on
Alarm System Overview
Calclimitupper MAX,@101LOWER 9,@101LOWERSTATE on
Alarm System Overview Alarm Limit Commands
OUTPut ALARm1234SOURce @xt ALARm1234SOURce?
CALCulate LIMitUPPer z LIMitUPPer? @x
CALCulate LIMitUPPerSTATe OFFON,@xt LIMitUPPerSTATe? @x
CALCulate LIMitLOWer z LIMitLOWer? @x
SYSTemALARm?
CALCulate LIMitLOWerSTATe OFFON,@xt LIMitLOWerSTATe? @x
Alarm System Overview Alarm Output Commands
OUTPut ALARmMODE LATChTRACk ALARmMODE?
OUTPut ALARmSLOPe NEGativePOSitive ALARmSLOPe?
Vz xvz z5
CALCulate COMPareTYPE EQUalNEQual,@x COMPareTYPE? @x
Alarm System Overview Digital I/O Alarm Commands
CALCulate COMPareDATA yvv ,@xt COMPareDATA? @x
CALCulate COMPareMASK COMPareMASK? @x
CALCulate COMPareSTATe OFFON,@x COMPareSTATe? @x
See also Digital Input Operations in starting on
Digital Input Commands
SENSeDIGitalDATABYTEWORD? @x
SENSe TOTalizeTYPE READRRESet,@x TOTalizeTYPE? @x
Totalizer Commands
See also Totalizer Operations in starting on
Commands see Reading Format Commands on
SENSe TOTalizeSLOPe NEGativePOSitive,@x TOTalizeSLOPe? @x
SENSeTOTalizeCLEarIMMediate @x
SENSeTOTalizeDATA? @x
Digital Output Commands
DAC Output Commands
SOURce DIGitalDATABYTEWORD yvv ,@xt DIGitalDATABYTEWORD? @x
SOURceDIGitalSTATe? @x
ROUTe CLOSe @x CLOSeEXCLusive @x CLOSe? @x
Switch Control Commands
ROUTe Open @x OPEN? @x
ROUTe CHANnelFWIRe Offon , @ CHANnelFWIRe? @
ROUTeDONE?
SYSTemCPON 100200300ALL
Zv z
SAV
State Storage Commands
RCL
MEMorySTATe Name 12345 ,z NAME?
MEMorySTATeDELete
MEMorySTATeVALid?
RECallAUTO?
MEMoryNSTates?
System-Related Commands
SYSTemDATE 3 3yy
SYSTemDATE?
SYSTemTIME 3
Oz v 7
DIAGnostic Pokeslotdata 100200300, zyt PEEKSLOTDATA?
SYSTemCTYPe?
DISPlay Text zyt
DISPlay Offon DISPlay?
DISPlayTEXTCLEar
SYSTemPRESet
INSTrument DMM Offon
Fxz5
Gfxz5
Gzz xv v xz z Ud EC7N z vz5
SYSTemERRor?
SYSTemVERSion?
Interface Configuration Commands
RS-232 Interface Configuration
RS-232 Interface Configuration
Gh6 Sy d
Gh6
Gh6 Tyyy
Yzv Or xz xvwz
Ud EC7N
Modem Communications
Modem Communications
Zz yz
For more information, see Flow Control Selection on
Scpi Status System
Ny y S gO
Ny yO
Ny yy gO
HP 34970A Status System
Bit Definitions Status Byte Register
Decimal Bit Number
Definition
128
Gzv d zzxzy vz hzz3 yxv w gzv d xzv Yxvz vzx Xz5 iz z
Ghgf2 y
Vvzz v xz Xzy wz zzx v gzv d5
Ly QQm2
S S
Bit Definitions Questionable Data Register
512
1024
2048
Scpi Status System
Bit Definitions Standard Event Register
Scpi Status System
Bit Definitions Alarm Register
Dy g
Bit Definitions Standard Operation Register
Status System Commands
Status Byte Register Commands
Vv xzy xvz C z z Gv g fz5 fzzvz
Gzz z wz vz 9CC z zz wz
Status System Commands Questionable Data Register Commands
STATusQUEStionableENABle zv STATusQUEStionableENABle?
Gzz z wz vz 9D7 z zz wz
STATusQUEStionableCONDition?
Gzz z wz vz 9D9 z zz wz
Status System Commands Standard Event Register Commands
ESE zv
Status System Commands Alarm Register Commands
STATusALARmCONDition?
STATusALARmEVENt?
STATusALARmENABle zv STATusALARmENABle?
Status System Commands Standard Operation Register Commands
STATusOPERationENABle zv STATusOPERationENABle?
Gzz z wz vz 9DA z zz wz
STATusOPERationCONDition?
Miscellaneous Status Register Commands
STATusPRESet
DATAPOINtsEVENtTHReshold t DATAPOINtsEVENtTHReshold?
PSC
Calibration Commands
CALibration?
CALibrationCOUNt?
CALibrationSECureCODE txyz
CALibrationSECureSTATe OFFON,xyz CALibrationSECureSTATe?
CALibrationSTRing zyt
CALibrationSTRing?
CALibrationVALue z CALibrationVALue?
Service-Related Commands
DIAGnosticDMMCYCLes?
DIAGnosticDMMCYCLesCLEar
DIAGnosticRELayCYCLes? @x
Preset state. h xy zz zzxPRESET z fxz5
WAI
An Introduction to the Scpi Language
An Introduction to the Scpi Language
Scpi gvyvy Py vw V is an
Syy i byy
Routchandelay 1TRIGSOUR EXT
HSeY Sy
Fy h
Wvvxz
HSeY ey
Channel list parameters specify one or
Using Device Clear
Using Device Clear
Hz ABORt x xyzy v vz v
Page
Error
∙ x o u
Execution Errors 101
102
103
105
Execution Errors 114j
121
123
124
Execution Errors 168
178
211
213
Execution Errors 230
310 350
410
420
Instrument Errors 111
201
202
203
Instrument Errors 221
225
226
251
Instrument Errors 261
271
272
281
Instrument Errors 303
305
306
307
Instrument Errors 501
502
511
512
Self-Test Errors
601 602
603
604
Calibration Errors
701
702 703
704
Calibration Errors 710 720
721
722
723
Error Messages
Page
BA8
Example Programs for Excel
G68
Insert
Excel 7.0 Example takeReadings Macro
VISAaddr =
BAB
BAC
Excel 7.0 Example ScanChannels Macro
Dim columnIndex As Integer
BAF
BAG
Ck qdnT User’s Guide6 o
Example Programs for C and C++
Ck qdnT User’s Guide6
++ Example dacout.c
++ Example statreg.c
BB9
Page
ABA
AFF
AG8
AG=
System Cabling and Connections
Lz k
Gz bz 0z
Uzz
Cable Type Nominal Impedance Capacitance Attenuation
99=
LvLv
3uqyu
Uj m
Copper-to
GxuuB
Gxuyw qs u
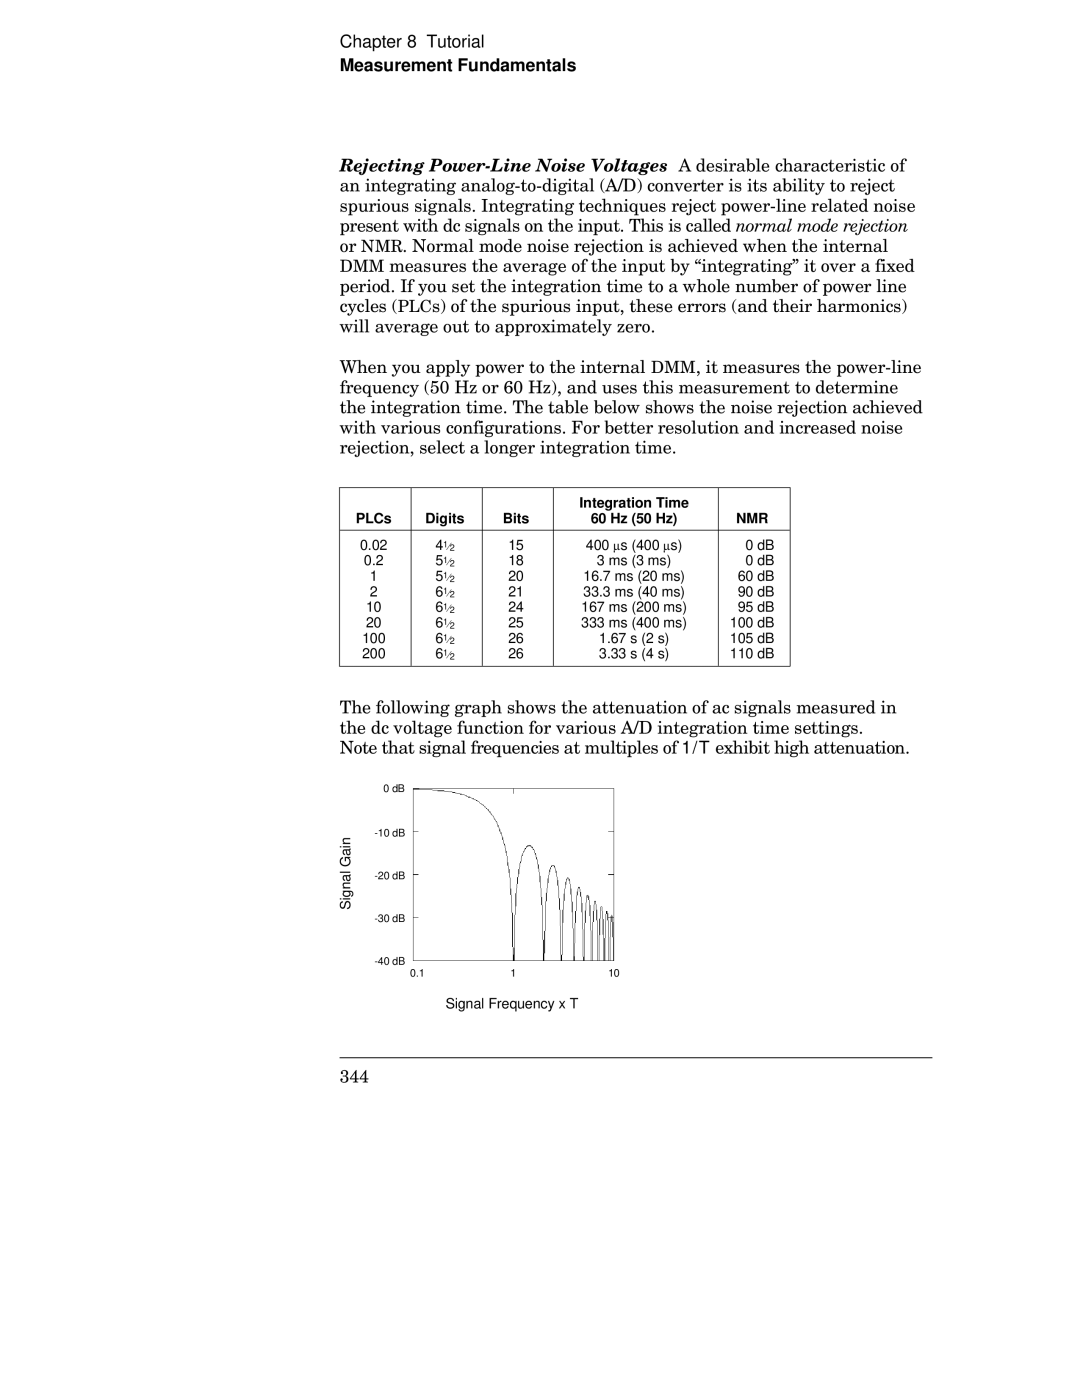
Measurement Fundamentals
Wuq
Z Uff4 Refer to Measurement Input on
Wsu
Integration Time PLCs
Bz mz 9GG8
Qysq Dxu qsuvqsu ytu qsusyvysq Vq tu4
Measurement Fundamentals
Internal DMM
Internal DMM Ice Bath
Ez b
Measurement Fundamentals
Temperature Probe Type Pos + Lead Neg Lead
Iron Constantan
Nickel-Chromium Nickel-Aluminum
Copper Constantan
Z4 z
MWW2
ABC
Nm w
99A
Stuqq
Connection a Connection B
Sl py
Sk p j
HI A1 AC to DC Converter X10 X100
360
361
Km w
Example Calculating Measurement Error
Hj s
N5zzz z5 z z 0 z AAD16
Voltage Measured = ‾‾‾‾‾‾‾‾‾‾‾‾√ V 2 + Noise
MWW
On-Card
Nm m
Km m
To Amplifier Analog-to-Digital Converter
HI-Source HI-Sense
For more information on channel delay, see
AB8
Offset Compensation on page 115 for more information
Does not sxqu
Zz4 z FF
Insulating Material Resistance Range Moisture Absorbing
Ai Sz e
HI Source HI Sense LO Sense LO Source
Strain DMM Sensitivity
376
Measurement Fundamentals
Low-Level Signal Multiplexing and Switching
V3Vu cyw Wuy q cyxy
ELo
4 AC8
HI + Source Sense
OUT COM H GND COM L
Zz AE
Module Reference
Module Bank
Actuators and General-Purpose Switching
Rp =
Dxu q u Ytu u qt Dxuuvu2 xu yy b Sq ru t qB
Module Reference
Matrix Switching
Wqy cyxy
Matrix Module
RF Signal Multiplexing
BO cyw
9A7
Multifunction Module
393
= 24 k Ω
GND TTL AC
For more information on cabling noise, see
U55R
EnkmF y
R B8 R URT z16 ∙ d qy s2 u .b Yu tyqwq Qr/ w
Nkm o
Relay Life and Preventative Maintenance
Buq Z
Qsuqsu wuqq
Uu utysuqqy4
AHe
AHf
AOO
AOT
DC, Resistance, and Temperature Accuracy Specifications
DC Voltage
DC Measurement and Operating Characteristics
Ki u y
AC Accuracy Specifications
Gi g
AC Measurement and Operating Characteristics
Gi u
Measurement Rates and System Characteristics
Single Channel Measurement Rates 1 System Characteristics
Module Specifications
TagHOr7 TagHPr7 TagHfr7 TagHTr7 TagHar
TagHcr7 TagHdr
Typical AC Performance Graphs
TagHer
Product and Module Dimensions
To Calculate Total Measurement Error
Understanding the % of reading Error o
Understanding the % of range Error o
× 1,000,000
Interpreting Internal DMM Specifications
417
Criteria
BdR u
LYR u
Configuring for Highest Accuracy Measurements
Vhh 87 b 87 q ∙ p =4 ∙ n ∙ n c 77 =8F
Index
Index
CAB
CAC
CAD
CAE
CAF
CAG
CAH
CB8
CB9
CBA
CBB
Declaration of Conformity
Ajjh