Using the Analyzer
To Log In to the Analyzer
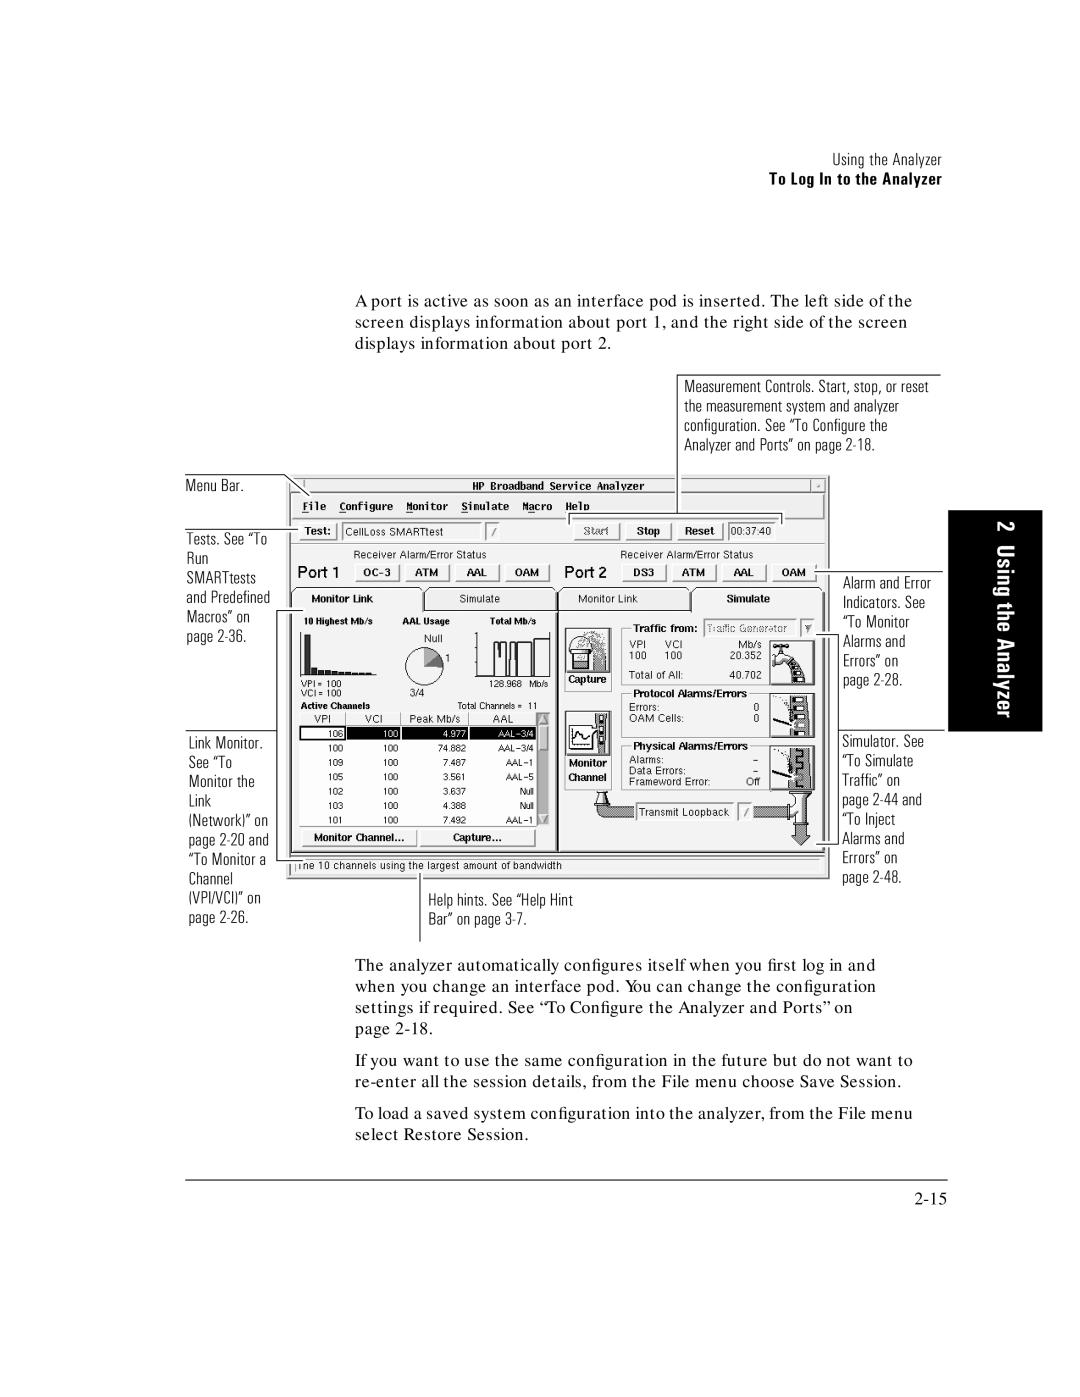
Menu Bar.
Tests. See “To Run SMARTtests and Predefined Macros” on ![]() page
page
Link Monitor. See “To Monitor the Link (Network)” on page
A port is active as soon as an interface pod is inserted. The left side of the screen displays information about port 1, and the right side of the screen displays information about port 2.
Measurement Controls. Start, stop, or reset the measurement system and analyzer configuration. See “To Configure the Analyzer and Ports” on page
Alarm and Error
Indicators. See “To Monitor ![]() Alarms and Errors” on page
Alarms and Errors” on page
Simulator. See “To Simulate Traffic” on page
Help hints. See “Help Hint
Bar” on page 3-7.
The analyzer automatically configures itself when you first log in and when you change an interface pod. You can change the configuration settings if required. See “To Configure the Analyzer and Ports” on page
If you want to use the same configuration in the future but do not want to
To load a saved system configuration into the analyzer, from the File menu select Restore Session.
2 Using the Analyzer