Using the Analyzer
To Monitor Alarms and Errors
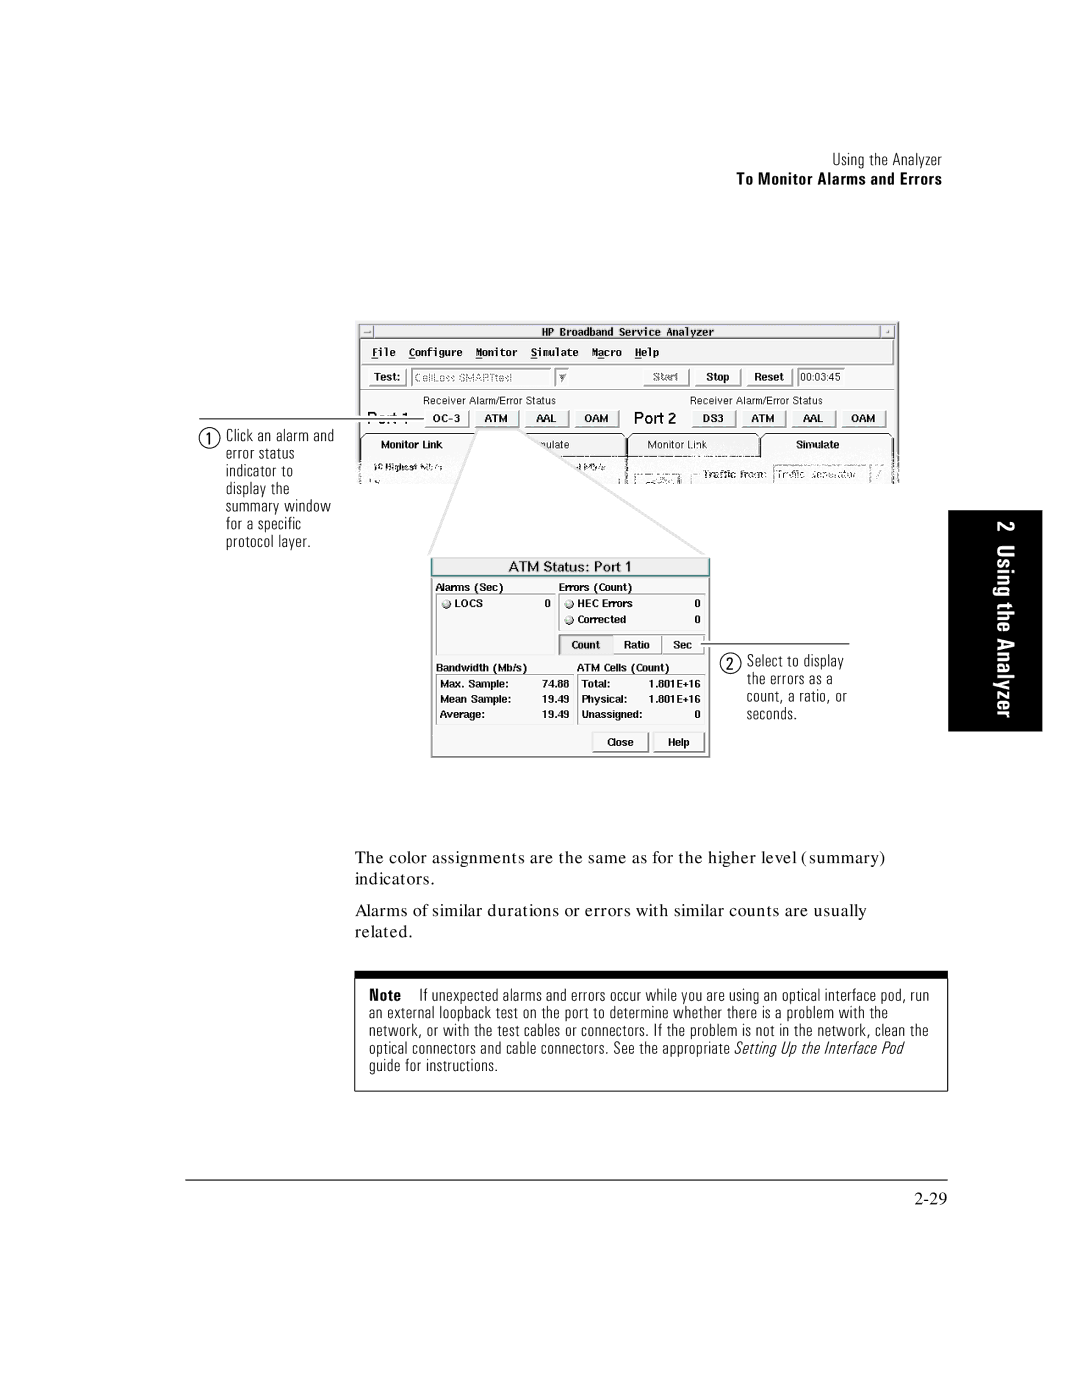
1Click an alarm and error status indicator to display the summary window for a specific protocol layer.
2 Select to display the errors as a count, a ratio, or seconds.
The color assignments are the same as for the higher level (summary) indicators.
Alarms of similar durations or errors with similar counts are usually related.
Note If unexpected alarms and errors occur while you are using an optical interface pod, run an external loopback test on the port to determine whether there is a problem with the network, or with the test cables or connectors. If the problem is not in the network, clean the optical connectors and cable connectors. See the appropriate Setting Up the Interface Pod guide for instructions.