Body Balance Comfort F5
Page
Page
Batterien einlegen
Einleitung
Wichtige Sicherheitshinweise
Uhrzeit einstellen
Installation
Dateneingabe
Dateneingabe starten und bestätigen
Page
Bedeutung der blinkenden Symbole
Körper-Analyse
Abruf Ihrer Analysewerte State
Trendkurven umgeschaltet werden
Änderung von Personendaten SET
Löschen von Personendaten DEL
Die Anzeigesymbole Ihrer Körper-Analysewaage
Trendanzeige
Körperfettanteil
Auswertung der Messergebnisse und individuelle Empfehlung
Abweichung von Ihrem persönlichen Normalwert Körpergewicht
Körpergewicht kg
Abweichung von Ihrem persönlichen Normalwert
Abweichung vom persönlichen Normalwert
Körperwasseranteil
Während im Display der Körperwasseranteil
Muskelanteil
Energieverbrauch
Niedriger Muskelanteil
Faktoren, die das Messergebniss beeinflussen
Wichtige Hinweise
Meldungen
Technische Daten
Batterie-Entsorgung
Verbraucher-Service
Entsorgung von gebrauchten elektronischen Geräten
Konformitätserklärung
Page
Insert batteries
Important advice
Introduction
Set the clock
Installation
Data input
Data are retained even when batteries are changed
Body analysis
Musceles in the body and the energy consump- tion kcal
Accessing your analysis values
State
Changing personal data SET
Deleting personal data DEL
Display symbols of your analysis scale
Trend curve
Monthly median value is determined based on 30 daily values
Individual recommendation
Proportion of body fat
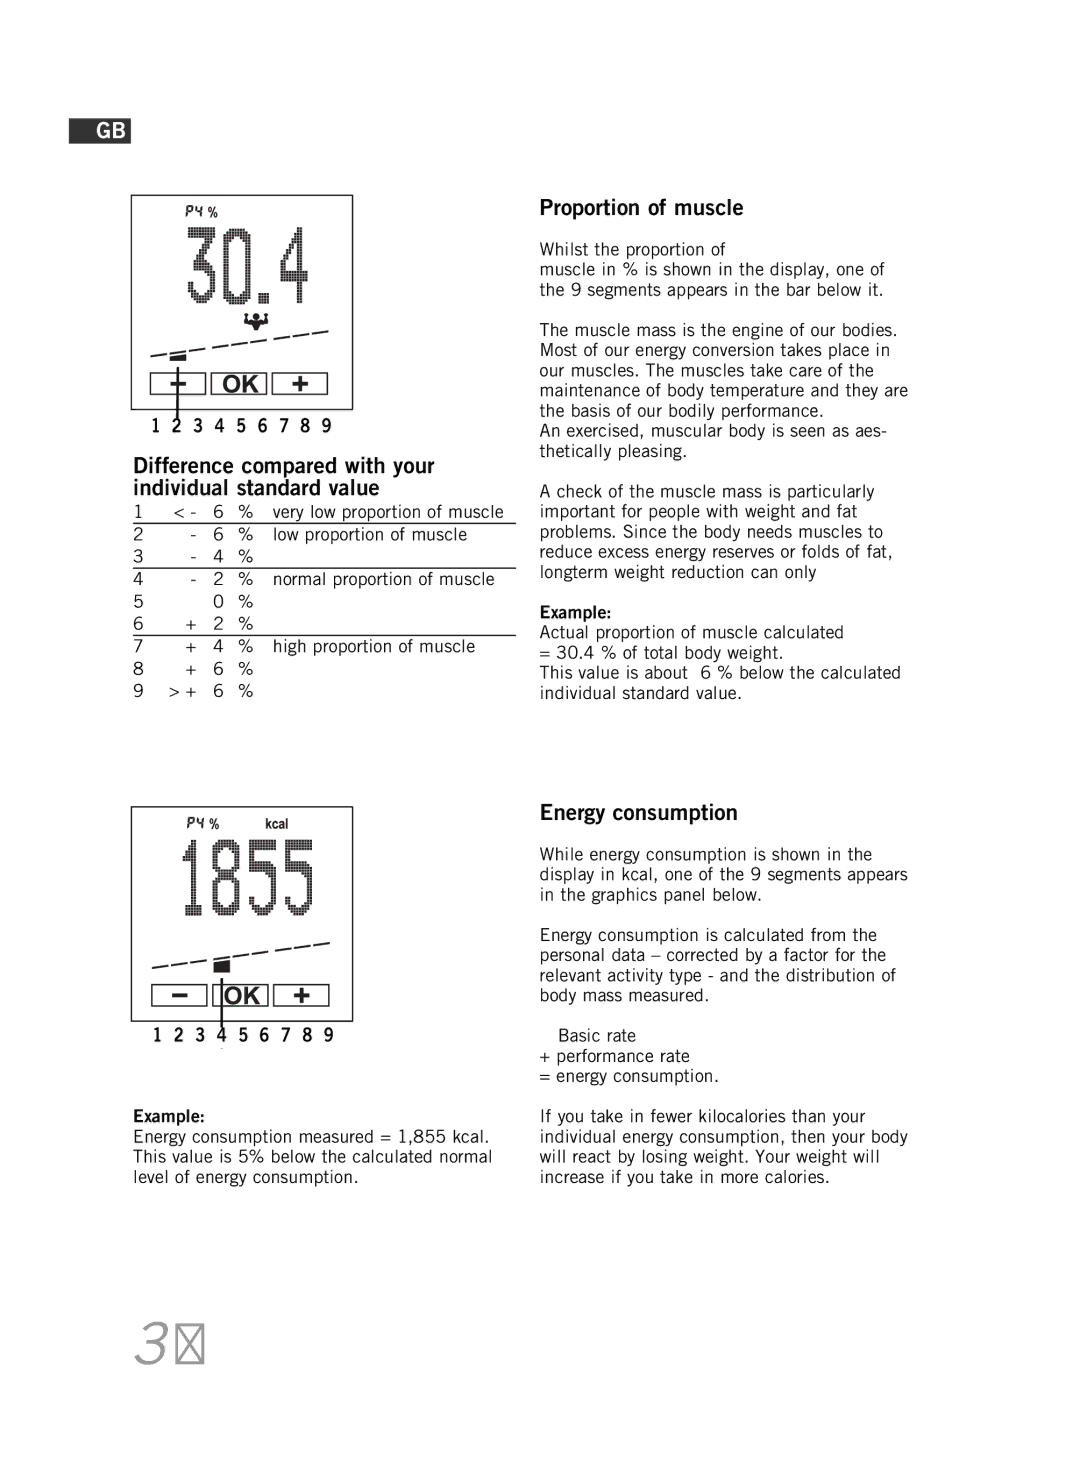
Difference compared with your individual standard value
Difference compared with your indivi- dual standard value
Proportion of body water
Low proportion of water
Proportion of muscle
Energy consumption
Factors influencing measurement readings
Important notes
Technical data
Messages
Warranty
Cleaning and care
Consumer service
Disposal of old electrical and electronic equipment
Page
Installer l’horloge
Avis de sécurité important
Remplacer les batteries
Et soulevez le couvercle. Après cela, percez
Introduction des données
Page
Analyse corporelle
Suppression de vos résultats ’analyse State
Tons, l’heure s’affiche à nouveau sur la Balance
Modification des données personnelles SET
Suppression des données personnelles DEL
Les symboles d’affichage de votre balance d’analyse
Affichage de tendance
Différence par rapport à votre valeur normale personnelle
Recommandation individuelle
Poids
Pourcentage de graisses du corps
Pourcentage d’eau du corps
Pourcentage de musceles
Consommation d’énergie
Facteurs qui influencent les résultats de mesure
Personnes en dialyse
Remarques importantes
Données techniques
Nettoyage et entretien
Service consommateurs
Elimination des piles
Déclaration de conformité
Page
Regolare l’ora
Introduzione Per la vostra sicurezza
Inserire le pile
Nella bilancia 4 x 1,5 V AA Nel terminal 3 x 1,5 V AA
Installazione
Inserimento dati
Page
Analisi composizione corporea
Con abiti di peso piuttosto differente
Richiamare i valori State
Cancellare i dati personali DEL
Modificare i dati personali SET
Visualizzazione dell’andamento
Simboli di visualizzazione della bilancia di analisi
Peso corporeo
Consiglio individuale
Allontanamento dal proprio valore personale normale
Percentuale di grasso nel corpo
Bassa
Percentuale di acqua nel corpo
Percentuale di acqua molto
Percentuale di acqua bassa
Massa muscolare
Consumo energetico
% Massa muscolare molto ridotta
Fattori che influenzano il risultato dellanalisi
Informazioni importanti
Avvisi
Scheda tecnica
Pulizia e manutenzione
Smaltimento delle batterie
Dichlarazione di conformitá
Servizio consumatori
Page
Batterijen aanbrengen
Inleiding
Belangrijke aanwijzingen
Tijd instellen
Installatie
Opgepast! Slipgevaar bij natte oppervlakken
Gegevensingave
Page
Bevestigen
Lichaamsanalyse
Uw analysewaarden zijn in orde
Bij veranderingen van meer dan
Oproepen van uw analysewaarden State
Persoonlijke gegevens wijzigen SET
Persoonlijke gegevens wissen DEL
De symbolen van uw analyseweegschaal
Trendindicatie
Individuele aanbeveling
Aandeel van het lichaamsvet
Afwijking van uw persoonlijke, normale waarde
Lichaamsvochtaandeel
Segmenten
Spieraandeel
Energieverbruik
Laag spierpercentage
Factoren die het meetresultaat beïnvloeden
Daarom raden wij in het begin aan om een dagtrend te kiezen
Meldingen
Technische gegevens
Batterijen afvoeren
Consumentenservice
Verwijderen van gebruikte elektoni- sche toestellen
Conformiteitverklaring
Page
Introducción Indicaciones importantes
Colocar las baterías
Ajustar la hora
Instalación
Atención! Peligro de resbalamiento con una superficie húmeda
Introducción de datos
Page
Análisis corporal
Acceso a sus valores de análisis
Modificación de datos personales SET
Eliminación de datos personales DEL
Indicación de la tendencia
Los símbolos de su peso analítico
Porción de grasa corporal
Recomendatión individual
Desviación de su valor personal normal Peso corporal
Peso corporal kg
Porción de agua muy baja
Desviación de su valor personal normal
Porción de agua corporal
Porción de agua baja
Porción muscular
Consumo de energía
Factores que influyen en el resultado de la medición
Instrucciones importantes
Avisos
Datos técnicos
Limpieza y cuidado
Desocho de la batería
Declaratión de conformidad
Servicio al consumidor
Page
Avisos importantes
100
Introdução
Colocar pilhas
101
Instalação
102
Introdução de dados
103
Ocupação leve, activa, sentada e em pé
104
Análise corporal
+ Recomenda-se mudança de regime alimentar
Iniciar consulta
105
Visualização dos seus valores de análise State
ConfirmarSTATE
Eliminação de dados pessoais DEL
106
Alteração de dados pessoais SET
Quando por exemplo Aumenta a idade em 1 ano aniversário
107
Indicação de tendência
Os símbolos de indicação da sua balança de análise
Desvios do seu valor normal pessoal
108
Aconselhamento individual
Percentagem de gordura corporal
109
Percentagem de água corporal
110
Percentagem de músculo
Consumo de energia
111
Factores que influenciam os valores de medição
112
Indicações importantes
113
Mensagens
Dados técnicos
114
Page
Viktiga säkerhetsanvisningar
116
Inledning
Sätt i batterierna
117
118
Inskrivning av data
119
120
Kroppsanalys
121
Hämta dina analysvärden State
122
Ändra persondata SET
Radera persondata DEL
Indikeringssymbolerna på Din analysvåg
123
Trendindikering
Avvikelsen från ditt personliga normalvärde
124
Individuel rekommendation
Kroppsvikt
125
Andelen vatten i kroppen
Energiförbrukning
126
Andelen muskler
Mycket låg muskelandel
127
Faktorer som påverkar mätresultatet
128
Viktig information
129
Meddelanden
Teknisk data
130
Page
Vigtige sikkerhedsanvisninger
132
Indledning
Isætning af batterier
133
134
Dataindtastning
135
136
Kropsanalyse
137
Hentning af dine analyseværdier
138
Ændring af persondata SET
Sletning af persondata DEL
Visningssymboler for analysevægten
139
Tendensvisning
Kropsvægt
140
Individuel anbefaling
Afvigelse fra din personlige normalværdi
141
Kropsvandandel
Energiforbrug
142
Muskelandel
Lav muskelandel
143
Faktorer, som påvirker måleresultatet
144
Vigtige anvisninger
Derfor anbefaler vi, at du først vælger en dagstrend
145
Meddelelser
Tekniske data
Bortskaffelse af batterier
Kundeservice
146
Obverensstemmelseserklæring
FIN
Tärkeät turvaohjeet
148
Johdanto
Paristojen asettaminen paikoilleen
149
Valmistelu
150
Tietosyöttö
151
152
Kehonanalyysi
153
Analyysiarvojesi haku State
154
Henkilötietojen muutos SET
Henkilötietojen poisto DEL
Analyysivaakasi näytönsymbolit
155
Suuntausnäyttö
Poikkeama henkilökohtaisesta Normaaliarvostasi Kehonpalno
156
Yksilöllinen suositus
Kehon rasvapitoisuus
157
Poikkeama henkilökohtaisesta normaaliarvostasi
Kehon nestepitoisuus
Energiankulutus
158
Lihasten osuus
Erittäin pieni lihasten osuus
159
Tekijät, jotka vaikuttavat mittaustulokseen
160
Tärkeitä ohjeita
161
Ilmoitukset
Tekniset tiedot
162
Page
Tegye be a telepeket
164
Bevezetés
Óra beállítása
165
Beépítés
166
Adatok beadása
167
168
Test összetételének elemzése
Szálljon le a mérlegről. a mérleg önműködően lekapcsol
169
Kielemzett értékek behívása
170
Személyi adatok módosítása SET
Személyi adatok törlése DEL
171
Várható állapot kijelzése
Testelemző mérleg kijelzőjén látható jelképek
Eltérés az Ön személyes normál értékétől Testsúly
172
Egyéni ajánlás
Testzsír arány
173
Eltérés az Ön személyes normál értékétől
Testvíz arány
Energiaszükséglet
174
Izomarány
Alacsony izomarány
175
Mérési eredményeket befolyásoló tényezők
Alacsony energiaszükséglet
176
Fontos útmutatások
Technikai adatok
177
Jelzések
Rossz lábkontaktus
178
Page
Włóż baterie
180
Wprowadzenie Istotne wskazówki bezpieczeństwa
Ustawianie zegara
181
Instalacja
182
Wpisywanie danych
Rozpocząć wpisywanie danych Zatwierdzić
183
184
Analiza organizmu
185
Wywołanie wyników analizy State
186
Zmiana indywidualnych danych SET
Usuwanie indywidualnych danych DEL
Symbole na wyświetlaczu
187
Krzywe trendu
Ciężar ciała
188
Zalecenia indywidualne
Oraz odchylenie od Państwa normy
189
Ilość wody ustrojowej
Zużycie energii
190
Ilość mięśni
Niska ilość mięśni
Bardzo niska ilość zużycie energii
191
Czynniki wpływające na wynik pomiaru
Niska ilość zużycie energii
192
Ważne wskazówki
Jak przeprowadzać prawidłowo pomiar?
Dane techniczne
193
Komunikaty
Zły kontakt stóp
194
Page
Důležité bezpečnostní předpisy
196
Úvod
Vložení baterií
197
Instalace
198
Zadávání dat
199
200
Tělesná analýza
201
Vyvolání vašich analytických hodnot
Vymazání osobních dat DEL
202
Změna osobních údajů SET
Například Je-li věk zvýšen o 1 rok narozeniny
Symboly zobrazení Vaší analytické váhy
203
Zobrazení trendu
Tělesná hmotnost
204
Individuální doporučení
Odchylka od Vaší nor mální osobní hodnoty
205
Podíl vody v organismu
206
Podíl svalové hmoty
Spotřeba energie
Velmi nízký podíl Spotřeba energie
207
Faktory, které ovlivňují výsledky měření
Nízký podíl Spotřeba energie
208
Důležité pokyny
Technické údaje
209
Hlášení
Opotřebované baterie
210
RUS
212
‚‰ÂÌËÂ
213
·Ó͇
214
‚Ó‰ ‰‡ÌÌ˚ı
215
Ïëìëïûï ‰‚Ë„‡ÚÂθÌÓÈ ‡ÍÚË‚ÌÓÒÚË Ï‡ÍÒ ˜./‰Â̸
216
ȦÎËÁ Ë̉ÂÍÒ‡ χÒÒ˚ Ú·
217
State
218
ÀÁÏÂÌÂÌË ÔÂÒÓ̇θÌ˚ı ‰‡ÌÌ˚ı SET
219
ÉÚÓ·‡ÊÂÌË ÚẨ‡
220
À̉˂ˉۇθ̇fl ÂÍÓÏẨ‡ˆËfl
221
ÑÓÎfl ‚Ó‰˚ ‚ χÒÒ Ú·
222
ÑÓÎfl Ï˚¯Â˜ÌÓÈ Ï‡ÒÒ˚
223
‡ÍÚÓ˚, ‚ÎËfl˛˘Ë ̇ ÂÁÛθڇÚ˚ ËÁÏÂÂÌËÈ
224
‡ÊÌ˚ Û͇Á‡ÌËfl
225
ËÓÓ·˘ÂÌËfl
226
ÌÚËÎËÁ‡ˆËfl ·‡Ú‡ÂË
Page
Pillerin yerleµtirilmesi
228
Giriµ
Saat ayarı
229
Kurulum
Tüm ölçümler için teraziyi düz ve saπlam bir yüzeye koyunuz
230
Veri giriµi
231
232
Vücut analizi
233
Analiz deπerlerinin çaπırılması
Eπrileri arasında geçiµ yapılabilir
234
Kiµiye ait verilerin deπiµtirilmesi SET
Kiµiye ait verilerin silinmesi DEL
235
Geliµme göstergesi
Analiz terazinizdeki gösterge simgeleri
Aπırlık
236
Özel tavsiye
Kiµisel normal deπerden sapma
Düµük su oranı
237
Vücuttaki su oranı
% Normal su oranı
Enerji tüketimi
238
Kas oranı
Temel oran
239
Ölçüm sonucunu etkileyen etkenler
240
Önemli uyarılar
Nasıl doπru ölçüm yapılır?
241
Mesajlar
Teknik özellikler
Temizlik ve bakım
242
Pilin atılması
Tüketici servisi
Page
Σηµαντικές οδηγίες
244
Εισαγωγή
Τοποθέτηση µπαταριών
245
Εγκατάσταση
Πλήκτρο να επιστρέψετε ξανά στην κατάσταση ώρας
246
Εισαγωγή δεδοµένων
Έναρξη εισαγωγής δεδοµένων και επιβεβαίωση
247
Ρυθµίστε την επιθυµητή τιµή του τύπου κίνησης = down
248
Λιποµέτρηση
249
Εµφάνιση των τιµών ανάλυσής σας State
250
Αλλαγή των προσωπικών στοιχείων σας SET
∆ιαγραφή των προσωπικών στοιχείων σας DEL
Τα σύµβολα των ενδείξεων της ζυγαριάς σας
251
Ένδειξη τάσης
Την καµπύλη τάσης βρίσκεται
Απόκλιση από την προσωπική σας κανονική τιµή
252
Ατοµική σύσταση
Σωµατικό βάρος
253
Ποσοστό νερού
254
Ποσοστό µυών
Κατανάλωση ενέργειας
255
Συντελεστές που επηρεάζουν το αποτέλεσµα της µέτρησης
256
Σηµαντικές υποδείξεις
Τεχνικά στοιχεία
257
Μηνύµατα
Υπερφόρτωση Από 150 kg
258
SLO
Pomembni varnostni nasveti
260
Uvod
Namestitev baterij
261
Instalacija
262
Vpis podatkov
263
264
Telesna analiza
265
Priklic rezultatov vaše analize State
266
Sprememba osebnih podatkov SET
Brisanje osebnih podatkov DEL
267
Telesna teža
268
Individualno priporočilo
Odstopanje od vaše osebne normalne vrednosti
269
Odstopanje od vaše osebne normal- ne vrednosti
Delež vode v telesu
270
Delež mišičnega tkiva
Porabo energije
271
Faktorji, ki vplivajo na izmerjene vrednosti
Nizek poraba energije
272
Pomembni nasveti
273
Javljanje
Tehnični podatki
274
Page
Stavite baterije
276
Uvod Važne bezbednosne napomene
Podesiti časovnik
277
278
Unošenje podataka
279
280
281
Poziv Vaših rezultata analize State
282
Izmena ličnih podataka SET
Brisanje ličnih podataka DEL
283
Prikaz tendencije
Prikazani simboli Vaše vage za analizu
Tjelesna težina
284
Individualna preporuka
Odstupanje od Vaše osobne uobičaje- ne vrijednosti
285
Odstupanje od Vaše osobne uobiča- jene vrijednosti
Udjel vode u tIuelu
286
Udjel mišiIća
Potrošnja energije
Faktori koji utječu na rezultate mjerenja
287
Odstupanje od Vaše osobne uobičajene vrijednosti
Nizak potrošnja energije
288
Važne napomene
289
Poruke
Tehnički podaci
290
Page
Leifheit AG