May Updated January
Cisco Support Tools User Guide
Release
Table of Contents
Section I. Using Cisco Web Utilities
Section II. Using Cisco Web Utilities from the Dashboard
Section IV. Using Cisco Common Utilities 152
Section V. Using Common Utilities 204
276
Part 5 Reference
Audience
About Cisco Support Tools Documentation
Support Tools Documentation Set
To Access Support Tools Documentation
Support Tools Document Conventions
Part 1 Support Tools Overview
Key Features
About Cisco Support Tools
See Also
About Cisco Support Tools 1.01
About Support Tools Components
Support Tools Server
Support Tools Node
See Also
About Support Tools Network Topology
About Support Tools Network Topology
Utility Installation Locations
About Support Tools Utilities
Non-Dashboard Utilities
Privileged Utilities
Command-Line vs GUI Access
Cisco Web Utilities
Support Tools Utilities List
ICM
Cisco Common Utilities
Common Utilities
All Support Set of files Tools nodes Findstr
Qualified DNS of the current systems
Windows NT
Accessing Dashboard
About the Support Tools Dashboard
Dashboard Privileges
See Also
About Support Tools Security
About Support Tools Platforms
ICM Platform
Support Tools Server Platform
Support Tools Dashboard Browser Support
Support Tools Node Platform
Frequently Asked Questions About Support Tools
See Also
Part 2 Installing and Configuring Support Tools
Section I. Installing Support Tools
Support Tools Installation Tasks
About Installing Support Tools
Collect information for the install
Create the Support Tools privileged user group
Install the Support Tools Server
Install the Support Tools Node
Create the Distinguished User Account
Post-Installation Configuration
Enable ports for Support Tools
Test the installation
See Also
About the Network Time Server
How to Collect Information for a Support Tools Installation
See Also
How to Create Support Tools User Groups
To Create Support Tools User Groups
Creating Local Accounts on the Support Tools Server
See Also
How to Create the Distinguished User Account
How to Create the Distinguished User Account
Cisco Support Tools 1.0 User Guide
Support Tools Server Hardware Prerequisites
Support Tools Server Software Prerequisites
Additional Software Prerequisites
Network Access to ICM Nodes
To Install the Support Tools Server
How to Install the Support Tools Server
Cisco Support Tools 1.0 User Guide
See Also
Support Tools Node Software Prerequisites
Support Tools Node Hardware Prerequisites
To Install the Support Tools Node
How to Install the Support Tools Node
See Also
How to Enable Ports for Support Tools
Tomcat Http and Https Port
Support Tools Listening Port
How to Enable Ports for Support Tools
How to Test the Support Tools Installation
To Access the Support Tools Dashboard
To Test the Connection to a Support Tools Node
How to Test the Support Tools Installation
Section II. Configuring Support Tools
About Configuring Support Tools
To Modify Support Tools Server Configuration
How to Modify Support Tools Basic Configuration
To Modify Support Tools Node Configuration
See Also
How to Disable Continuous Virus Scan for the Repository
To Configure the Dashboard Login for SSL
How to Configure the Dashboard Login for SSL
Http//hostname8188
Modifying the Process Information List
How to Modify the Process Information List
Distributing a Modified Process Information List
See Also
To Install WMI
Section III. Uninstalling/Reinstalling Support Tools
How to Uninstall Support Tools
To Uninstall the Support Tools Server
To Uninstall the Support Tools Node
See Also
Restoring Customized .bak Files After Re-installation
How to Re-Install Support Tools
SSL INF\
Part 3 Using the Support Tools Dashboard
Accessing Utilities in the Dashboard
About Using the Dashboard for the First Time
Selecting a System to Work With
Adding a System to the System List
Navigating and Refreshing Pages in the Dashboard
How to Access the Support Tools Dashboard
To Select the Current System
How to Use the Select System Screen
To Add a Support Tools Node to the System List
How to Use the System Management Screen
To Add a Node to the System List
To Test the Connection to a Node
To delete a Support Tools node from the system list
To Delete a Node from the System List
How to End a Dashboard Session
Login/Connection Problems
About Dashboard Troubleshooting
Utility Problems
Administrator if you believe you
Part 4 Using Support Tools Utilities
Section I. Using Cisco Web Utilities
Cisco Web Utilities at a Glance
About Cisco Web Utilities
Section II. Using Cisco Web Utilities from the Dashboard
To View System Information
How to Use the System Interrogate Screen
OS/Hardware Information
ICM Information
ICM Node
Third-Party Information
To Save System Information to a File
See Also
How to Use the Registry Screen
To View an ICM Registry
Viewing Registries for Multiple Customer Instances
To Save Registry Settings to a File
To View a Saved File
How to Use the Files Screen
To Rename a File
To Delete a File
To Download a File
How to Use the Compare Registries Screen
To Compare the Current System to Another
To Compare the Current System to a Saved Registry File
Understanding the Compare Registries Display
To Compare Two Saved Registry Files
Viewing Registry Keys for Multiple Customer Instances
To Copy Key Values Between Registries and Files
To Save a Registry Comparison to a File
See Also
How to Use the Processes Screen
To View Processes
To Terminate a Process
To Save the Processes List to a File
To View Services
How to Use the Services Screen
To Stop or Start a Service
To Save the Services List to a File
Stopping and Starting Dependent Services
See Also
How to Use the Log Collector
Products Supported for Log Collection
Log Collection General Steps
What are Merged Logs?
Merge Log Limitations
Viewing Entries in Merged Logs
For example, an ICM log entry might be prefaced by
To Create a Log Group
How to Use the Create Log Group Screen
See Also
To View Details of a Log Group
How to Use the Log Groups Screen
To Edit a Log Group Definition
To Delete a Log Group
To Rename a Log Group
To Create a Log Collection
How to Use the Create Log Collection Screen
How to Use the Log Collector
How to Use the Log Collections Screen
To View Details of Log Collections
To Download Collected Logs
Log File Naming Conventions
To Delete a Log Collection
Section III. Using Cisco Web Utilities from a Command Line
About Using Cisco Web Utilities from a Command Line
Command-Line Mode vs Interactive Mode
Web Utilities Location
Selecting a System to Use
Selecting a Different Target System
Selecting a Different Application Server
Getting Help for Command Line Tools
Saving, Viewing, and Retrieving Files
Embedded Spaces
Example view my file.txt
How to Use the Services Utility from a Command Line
To Access the Services Utility from a Command Line
Using the Services Utility from a Command Line
Command Description Example
Command Line Options
Examples
Viewing and Stopping a Service
See Also
How to Use the Processes Utility from a Command Line
To Run the Processes Utility from a Command Line
Using the Processes Utility from a Command Line
Command Line Options
Viewing and Killing a Process
See Also
Using the System Interrogate Utility from a Command Line
To Run the System Interrogate Utility from a Command Line
Download
Viewing System Information
To Run the Registry Utility from a Command Line
How to Use the Registry Utility from a Command Line
Using the Registry Utility from a Command Line
Viewing Registry Information
See Also
To Run the Compare Registries Utility from a Command Line
Using the Compare Registries Utility from a Command Line
Another, or from a file to a registry, using values
Copying Key Values from one Registry to Another
Performing a Registry Comparison
See Also
To Run the Log Groups Utility from a Command Line
How to Use the Log Groups Utility from a Command Line
Using the Log Groups Utility from a Command Line
Creating a Log Group
Lgtool loggera
How to Use the Log Collection Utility from a Command Line
To Run the Log Collection Utility from a Command Line
Using the Log Collection Utility from a Command Line
Alg loggroupname
Creating a Log Collection Request
Downloading Collected Logs
Regardless of the extension specified, is always Zip
Section IV. Using Cisco Common Utilities
Accessing Cisco Common Utilities
About Cisco Common Utilities
Cisco Common Utilities Locations
Cisco Common Utilities at a Glance
Utility Name Description
Cisco Support Tools 1.0 User Guide 156
Cisco Support Tools 1.0 User Guide 157
How to Use the CICMan Utility
To Access CICMan from the Dashboard
To Access CICMan from a Command Line on a Node
Parameter Descriptions
Using CICMan
How to Use the CTITest Utility
To Access CTITest from the Dashboard
To Access CTITest from a Command Line on a Node
Configuring CTITest
Using CTITest
Logging
Opening a Session
Pri /skill N.pri
About Cisco Common Utilities
To Access DBDiff from the Dashboard
How to Use the DBDiff Utility
To Access DBDiff from a Command Line on a Node
Using DBDiff
Cisco ICM Administrator Guide
To Access DumpCfg from the Dashboard
How to Use the DumpCfg Utility
To Access DumpCfg from a Command Line on a Node
Using DumpCfg
See Also
Accessing Icmdba
How to Use the Icmdba Utility
To Access MPTrace from the Dashboard
How to Use the MPTrace Utility
To Access MPTrace from a Command Line on a Node
Using MPTrace
Command Line Options
To Access Nicroi from the Dashboard
How to Use the Nicroi Utility
To Access Nicroi from a Command Line on a Node
Method
Using Nicroi
Using Tracing in Nicroi
Log Files
Roilog.txt File
Examples
Setting the Download Directory
With SFK 4 Tracing
To Access NMStart from the Dashboard
How to Use the NMStart Utility
To Access NMStart from a Command Line on a Node
Using NMStart
See Also
To Access NMStop from the Dashboard
How to Use the NMStop Utility
To Access NMStop from a Command Line on a Node
Using NMStop
For example c\ nmstop cisco pg3a
How to Use the OPCTest Utility
To Access OPCTest from the Dashboard
To Access OPCTest from a Command Line on a Node
Using OPCTest
Example
Debug Information
Exiting and Quitting OPCTest
How to Use the Procmon Utility
To Access Procmon from the Dashboard
To Access Procmon from a Command Line on a Node
Using Procmon
Process-Specific and Troubleshooting Commands
Basic Commands
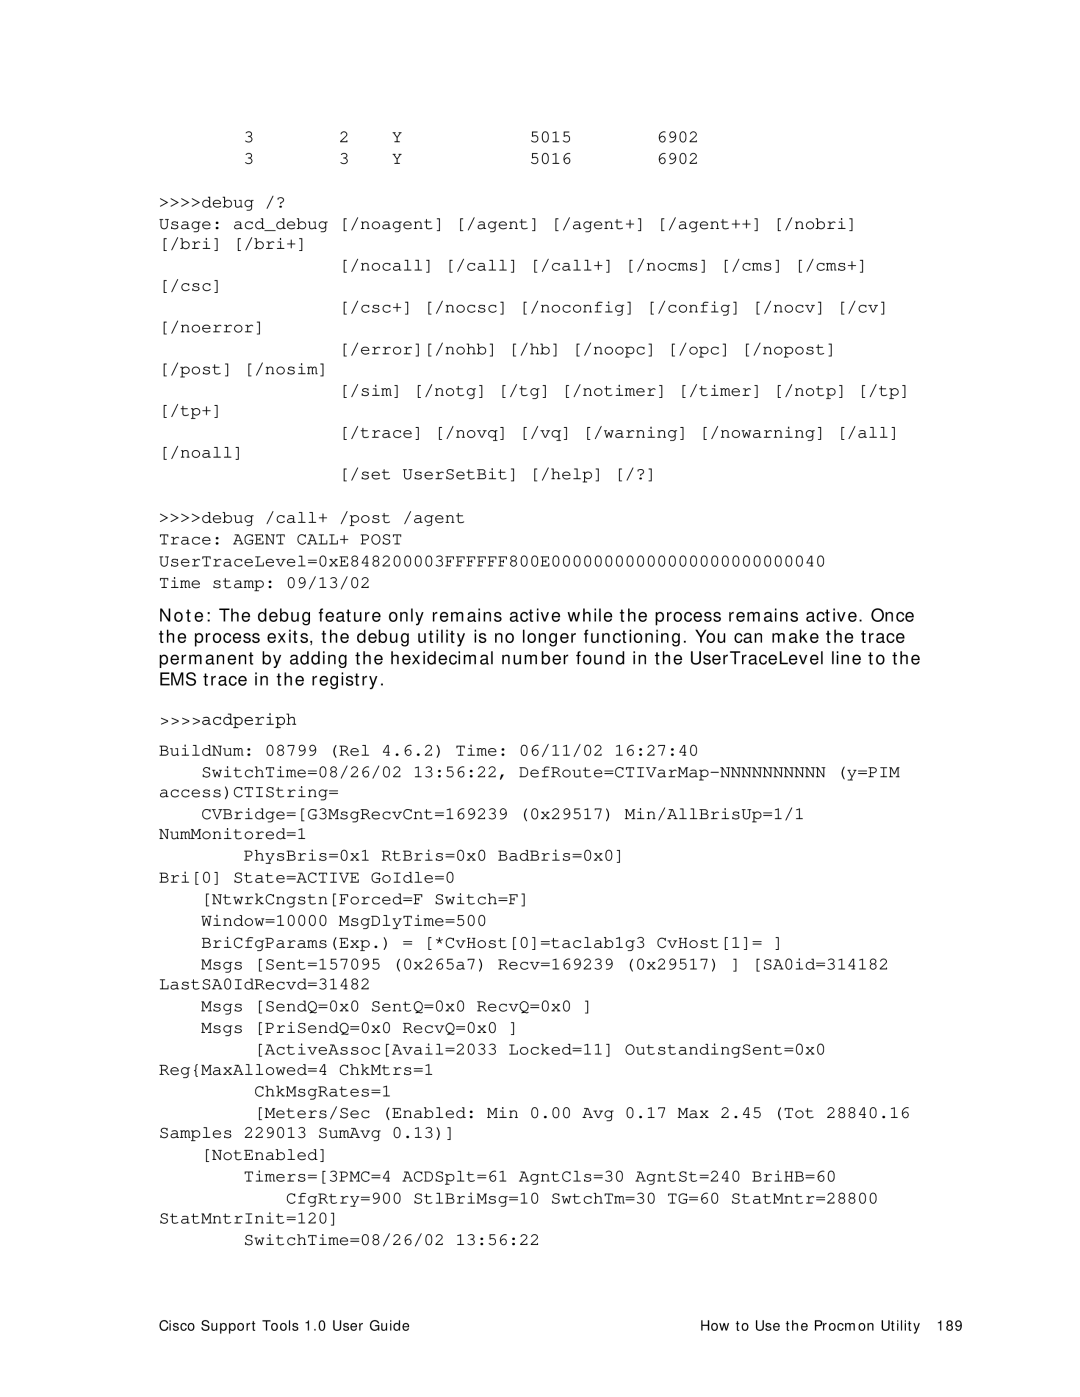
This section examines some sample Procmon output
Samples
Cisco Support Tools 1.0 User Guide
See Also
Accessing RTRTrace
How to Use the RTRTrace Utility
How to Use the RTTest Utility
To Access RTTest from the Dashboard
To Access RTTest from a Command Line on a Node
Using RTTest
Status Output
Status Output Process
Process LastStateChange LastHeartBeat
Status Output Peripheral
Status Output Controller
Peripheral LastStateChange LastHeardFrom
Parameter Descriptions
Cisco Support Tools 1.0 User Guide
Turning up ICM Call Router Tracing with RTTest
Cisco Support Tools 1.0 User Guide
Ending an RTTest Session
Turning Off Debug Tracing in RTTest
Accessing SS7NICTrace
How to Use the SS7NICTrace Utility
How to Use the VRUTrace Utility
To Access VRUTrace from the Dashboard
To Access VRUTrace from a Command Line on a Node
Using VRUTrace
Section V. Using Common Utilities
About Common Utilities
Accessing Common Utilities
Common Utilities Locations
Common Utilities at a Glance
All Support Set of files Tools nodes Findstr
Current system, including protocol
Touch
How to Use the Arp -a Utility
To Access Arp -a from the Dashboard
Example
To Access CAT from the Dashboard
How to Use the CAT Utility
Using CAT
Syntax
See Also
How to Use the Chmod Utility
To Access Chmod from the Dashboard
Using Chmod
Specifies whether the file should be writable or not
How to Use the CP Utility
To Access CP from the Dashboard
Using CP
Command Line Options
How to Use the DF Utility
To Access DF from the Dashboard
Using DF
See Also
How to Use the Diff Utility
To Access Diff from the Dashboard
Using Diff
N1 a n3,n4 N1,n2 d n3 N1,n2 c n3,n4
Page
How to Use the DU Utility
To Access DU from the Dashboard
Using DU
See Also
How to Use the FGrep Utility
To Access FGrep from the Dashboard
Using FGrep
See Also
How to Use the Findstr Utility
To Access Findstr from the Dashboard
Using Findstr
$ Line position end of line
See Also
How to Use the Grep Utility
To Access Grep from the Dashboard
Using Grep
+c*de?f\*$
See Also
How to Use the Head Utility
To Access Head from the Dashboard
Using Head
See Also
To Access IPConfig -all from the Dashboard
How to Use the IPConfig -all Utility
About Common Utilities Cisco Support Tools 1.0 User Guide
Accessing ISQL/W
How to Use the ISQL/W Utility
How to Use the LS Utility
To Access LS from the Dashboard
Using LS
? Display program description
See Also
How to Use the MV Utility
To Access MV from the Dashboard
Using MV
Command Line Options
How to Use the NBTStat Utility
To Access NBTStat from the Dashboard
Using NBTStat
About Common Utilities Cisco Support Tools 1.0 User Guide
To Access Net Session from the Dashboard
How to Use the Net Session Utility
To Access Net Statistics Server from the Dashboard
How to Use the Net Statistics Server Utility
About Common Utilities Cisco Support Tools 1.0 User Guide
To Access Net Statistics Workstation from the Dashboard
How to Use the Net Statistics Workstation Utility
See Also
How to Use the NetStat Utility
To Access NetStat from the Dashboard
Using NetStat
See Also
How to Use the NSLookup Utility
To Access NSLookup from the Dashboard
Using NSLookup
How to Use the PathPing Utility
To Access PathPing from the Dashboard
Using PathPing
See Also
How to Use the Ping Utility
To Access Ping from the Dashboard
Using Ping
See Also
To Access PStat from the Dashboard
How to Use the PStat Utility
See Also
How to Use the RM Utility
To Access RM from the Dashboard
Using RM
See Also
To Access Route -print from the Dashboard
How to Use the Route -print Utility
About Common Utilities Cisco Support Tools 1.0 User Guide
To Access Shutdown from the Dashboard
How to Use the Shutdown Tool Utility
Accessing Sqlew
How to Use the Sqlew Utility
How to Use the Stopshut Utility
To Access Stopshut from the Dashboard
Using Stopshut
How to Use the Strings Utility
To Access Strings from the Dashboard
Using Strings
See Also
How to Use the Tail Utility
To Access Tail from the Dashboard
Using Tail
See Also
How to Use the Touch Utility
To Access Touch from the Dashboard
Using Touch
See Also
How to Use the Tracert Utility
To Access Tracert from the Dashboard
Using Tracert
How to Use the WC Utility
To Access WC from the Dashboard
Using WC
Example
How to Use the Which Utility
To Access Which from the Dashboard
Using Which
See Also
Accessing WinMSD
How to Use the WinMSD Utility
Part 5 Reference
To Stop or Start the Support Tools Dashboard/Tomcat
How to Stop and Start the Support Tools Dashboard/Tomcat
To Stop or Start the Support Tools Server
How to Stop and Start the Support Tools Server
To Stop or Start the Node Agent Service
How Stop and Start the Node Agent Service
To Confirm the Support Tools Build Number
How to Confirm the Support Tools Build Number
Online Resources
Cisco Support for Support Tools
To Open a Technical Assistance Call
Providing Information to TAC
Telephone North America Outside North America
Copyright
Doc Version
Index
Dbdiff, 153
Https
Processes and Services, 86, 101
Servlet Engine Sessions Ending in Dashboard Shutdown utility
Software requirements, 43
URL