Q-Logic SANBOX2-8C/16 manual Using the Topology Display, Switch and Link Status

Models: SANBOX2-8C/16

1 266
Download 266 pages 59.06 Kb
Page 42
Image 42

2 – Using SANsurfer Switch Manager

0


Using the Topology Display


2.11

Using the Topology Display

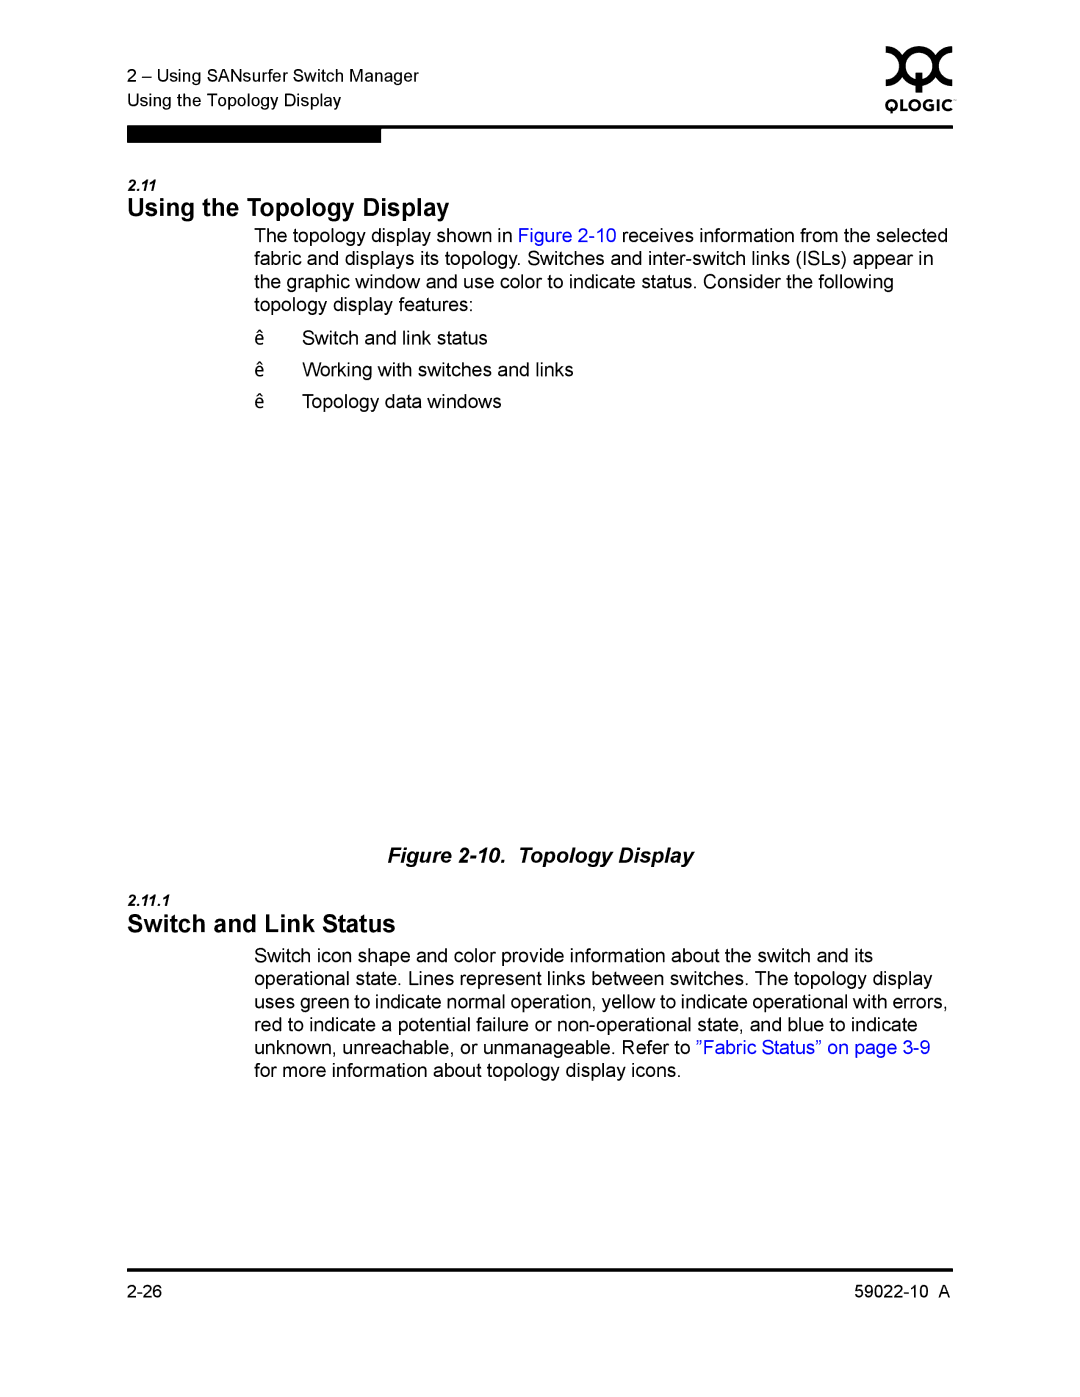
The topology display shown in Figure 2-10receives information from the selected fabric and displays its topology. Switches and inter-switch links (ISLs) appear in the graphic window and use color to indicate status. Consider the following topology display features:

„Switch and link status

„Working with switches and links

„Topology data windows

Figure 2-10. Topology Display

2.11.1

Switch and Link Status

Switch icon shape and color provide information about the switch and its operational state. Lines represent links between switches. The topology display uses green to indicate normal operation, yellow to indicate operational with errors, red to indicate a potential failure or non-operational state, and blue to indicate unknown, unreachable, or unmanageable. Refer to ”Fabric Status” on page 3-9for more information about topology display icons.

2-26

59022-10 A

Page 42
Image 42
Q-Logic SANBOX2-8C/16 manual Using the Topology Display, Switch and Link Status