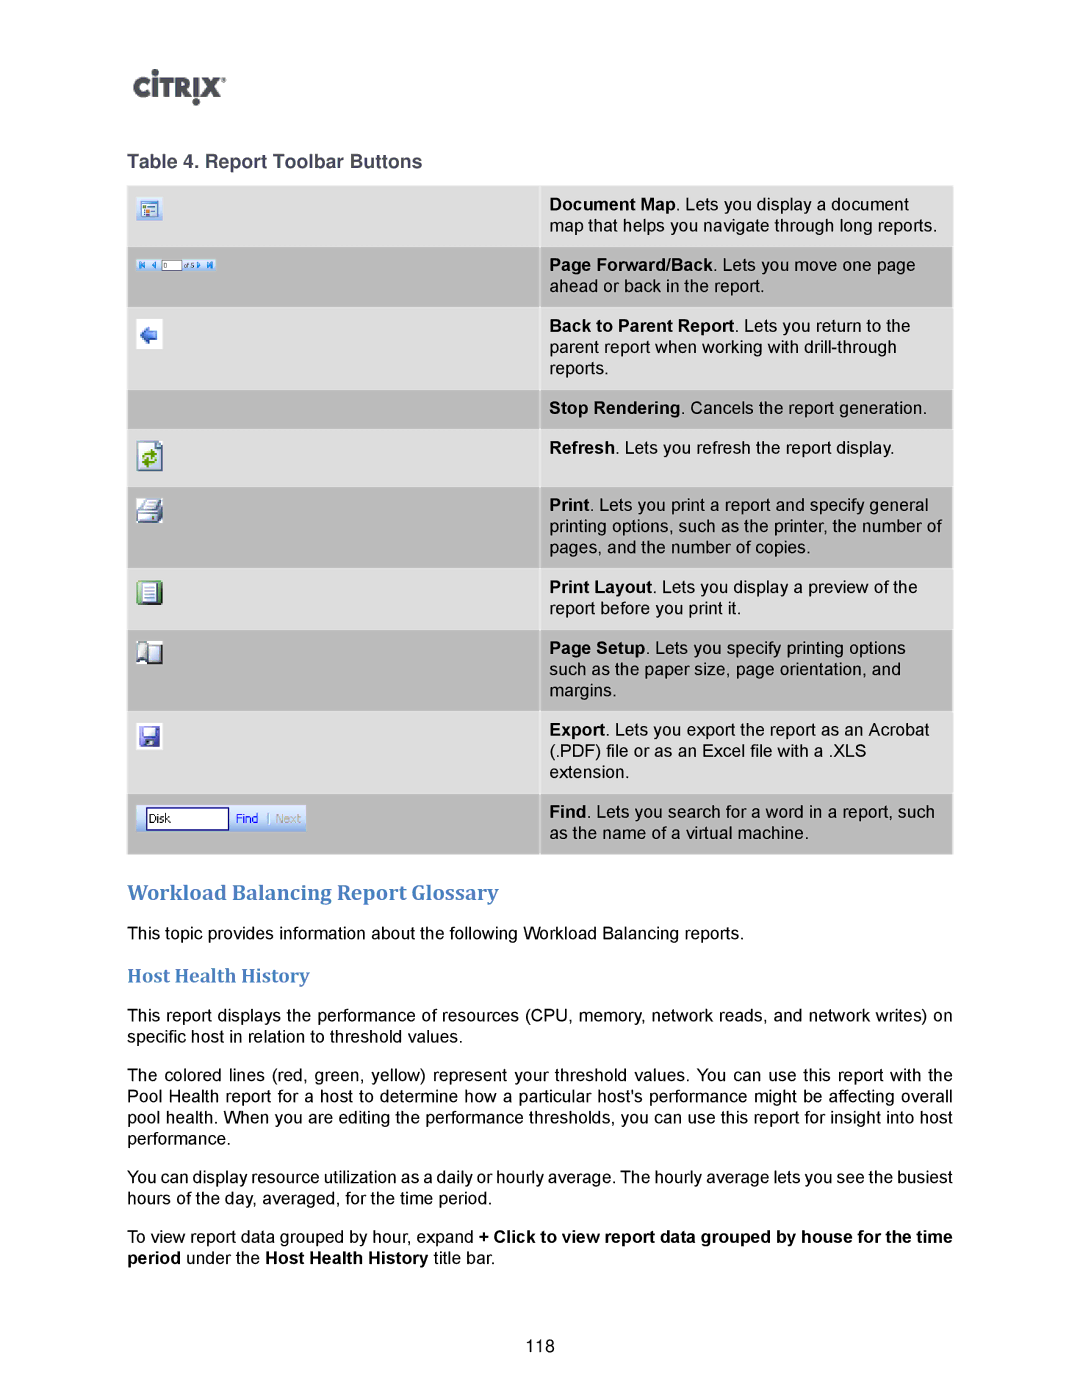
Table 4. Report Toolbar Buttons
Document Map. Lets you display a document map that helps you navigate through long reports.
Page Forward/Back. Lets you move one page ahead or back in the report.
Back to Parent Report. Lets you return to the parent report when working with
Stop Rendering. Cancels the report generation.
Refresh. Lets you refresh the report display.
Print. Lets you print a report and specify general printing options, such as the printer, the number of pages, and the number of copies.
Print Layout. Lets you display a preview of the report before you print it.
Page Setup. Lets you specify printing options such as the paper size, page orientation, and margins.
Export. Lets you export the report as an Acrobat (.PDF) file or as an Excel file with a .XLS extension.
Find. Lets you search for a word in a report, such as the name of a virtual machine.
Workload Balancing Report Glossary
This topic provides information about the following Workload Balancing reports.
Host Health History
This report displays the performance of resources (CPU, memory, network reads, and network writes) on specific host in relation to threshold values.
The colored lines (red, green, yellow) represent your threshold values. You can use this report with the Pool Health report for a host to determine how a particular host's performance might be affecting overall pool health. When you are editing the performance thresholds, you can use this report for insight into host performance.
You can display resource utilization as a daily or hourly average. The hourly average lets you see the busiest hours of the day, averaged, for the time period.
To view report data grouped by hour, expand + Click to view report data grouped by house for the time period under the Host Health History title bar.
118
