You can create multiple graphs. For example, if your network spans multiple floors or buildings, you might have a graph for each area. Additional graphs that you create appear as tabs at the top of the graph panel, as Figure 74 shows.
Figure 74. Multiple Graphs
To create additional graphs, repeat the steps in this section.
Graphing the WLAN Components
The WLAN Visualization tool automatically shows the WLAN components that the switch has discovered.
The panel lists the following component types:
•Switches (WCS and peer switches)
•Managed Access Points
•RF Scan Access Points
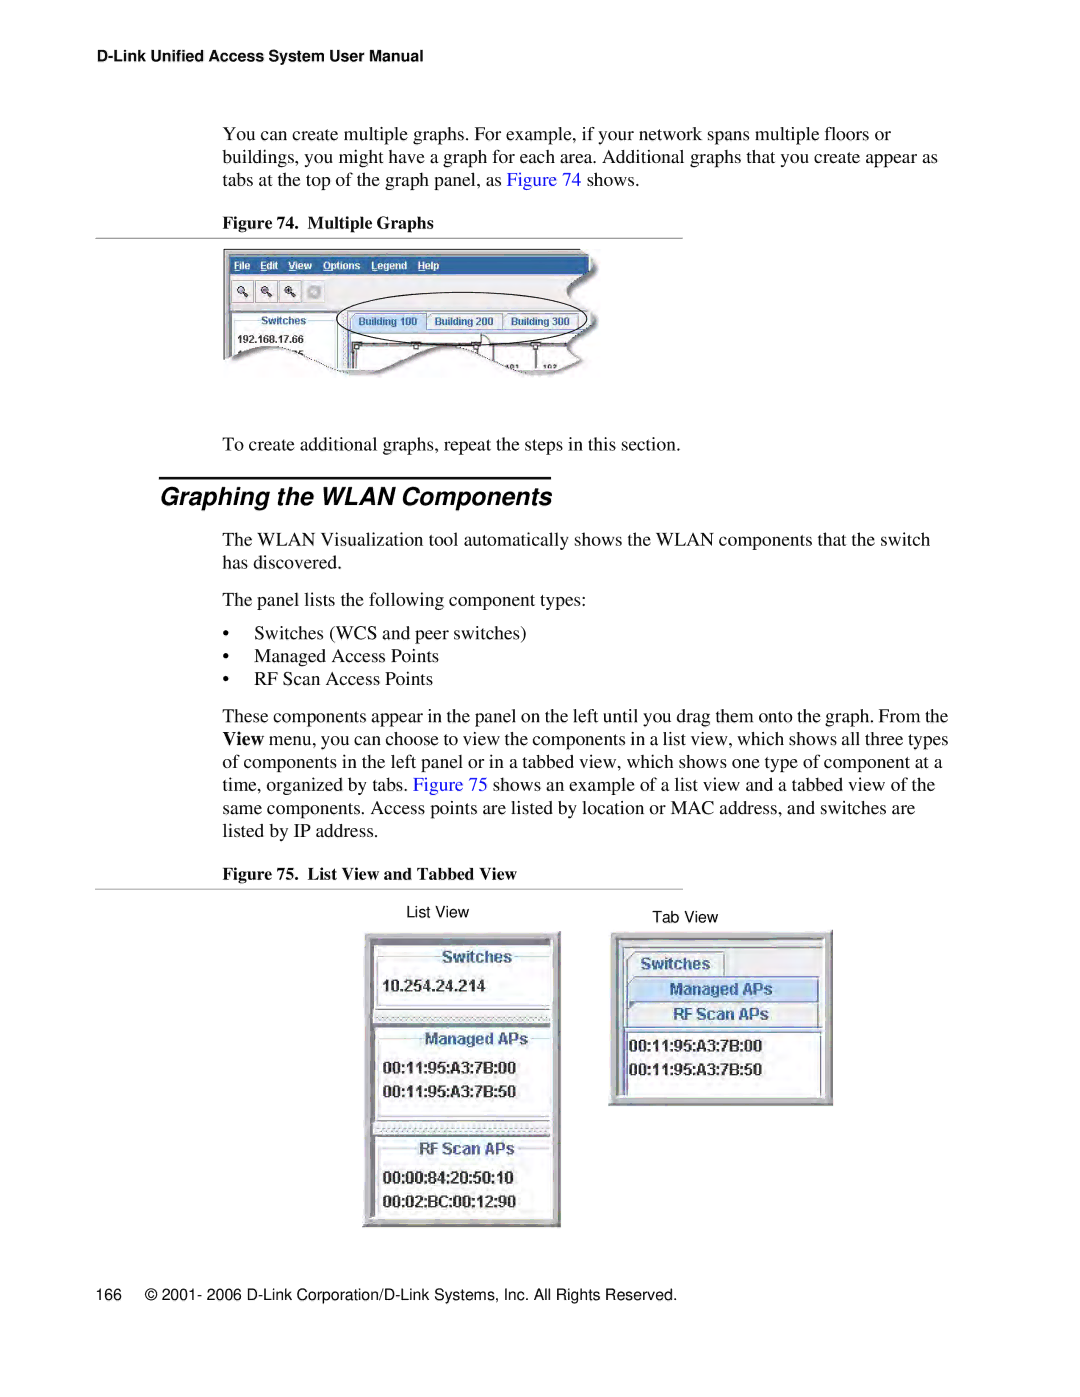
These components appear in the panel on the left until you drag them onto the graph. From the View menu, you can choose to view the components in a list view, which shows all three types of components in the left panel or in a tabbed view, which shows one type of component at a time, organized by tabs. Figure 75 shows an example of a list view and a tabbed view of the same components. Access points are listed by location or MAC address, and switches are listed by IP address.
Figure 75. List View and Tabbed View
List View | Tab View |
166 © 2001- 2006
