Q
3 – Managing Fabrics Displaying Fabric Information
3.3.2.1
Filtering the Event Browser
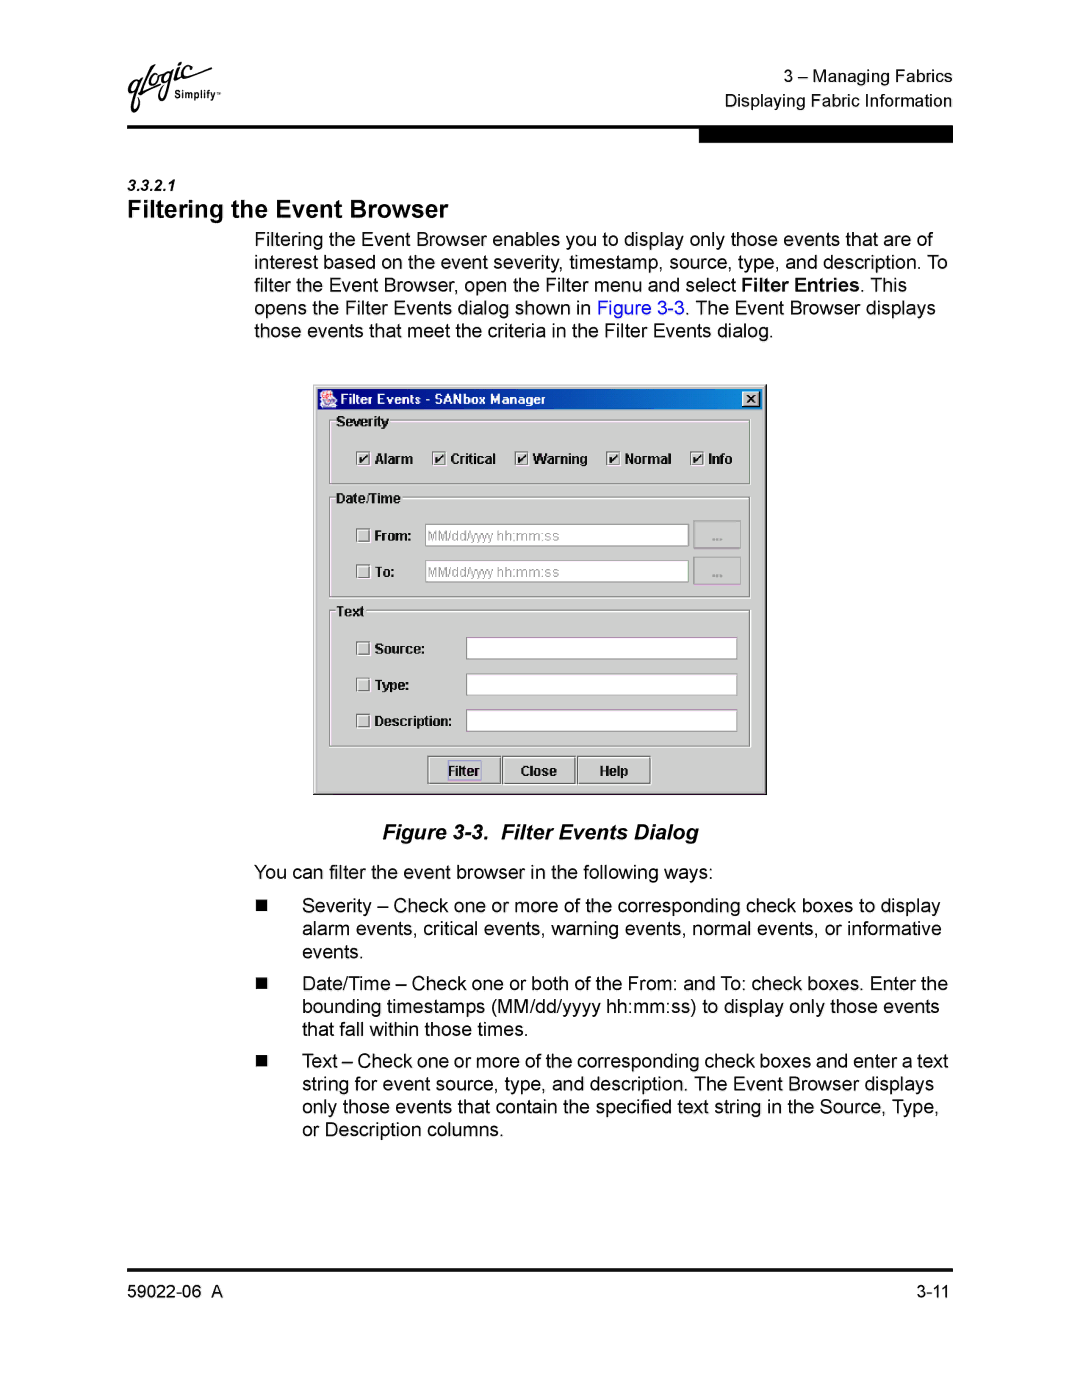
Filtering the Event Browser enables you to display only those events that are of interest based on the event severity, timestamp, source, type, and description. To filter the Event Browser, open the Filter menu and select Filter Entries. This opens the Filter Events dialog shown in Figure
Figure 3-3. Filter Events Dialog
You can filter the event browser in the following ways:
Severity – Check one or more of the corresponding check boxes to display alarm events, critical events, warning events, normal events, or informative events.
Date/Time – Check one or both of the From: and To: check boxes. Enter the bounding timestamps (MM/dd/yyyy hh:mm:ss) to display only those events that fall within those times.
Text – Check one or more of the corresponding check boxes and enter a text string for event source, type, and description. The Event Browser displays only those events that contain the specified text string in the Source, Type, or Description columns.