Bridging
To access the
1.Click on the desired Port button (![]() ) to display the Port menu.
) to display the Port menu.
2.Click on Performance Graph. The Bridge Performance Graph window will appear.
To access the
1.Click on the appropriate port index to access the Port menu.
2.Click on Performance Graph. The Bridge Performance Graph window will appear.
NOTE |
The graphic displayed in Figure
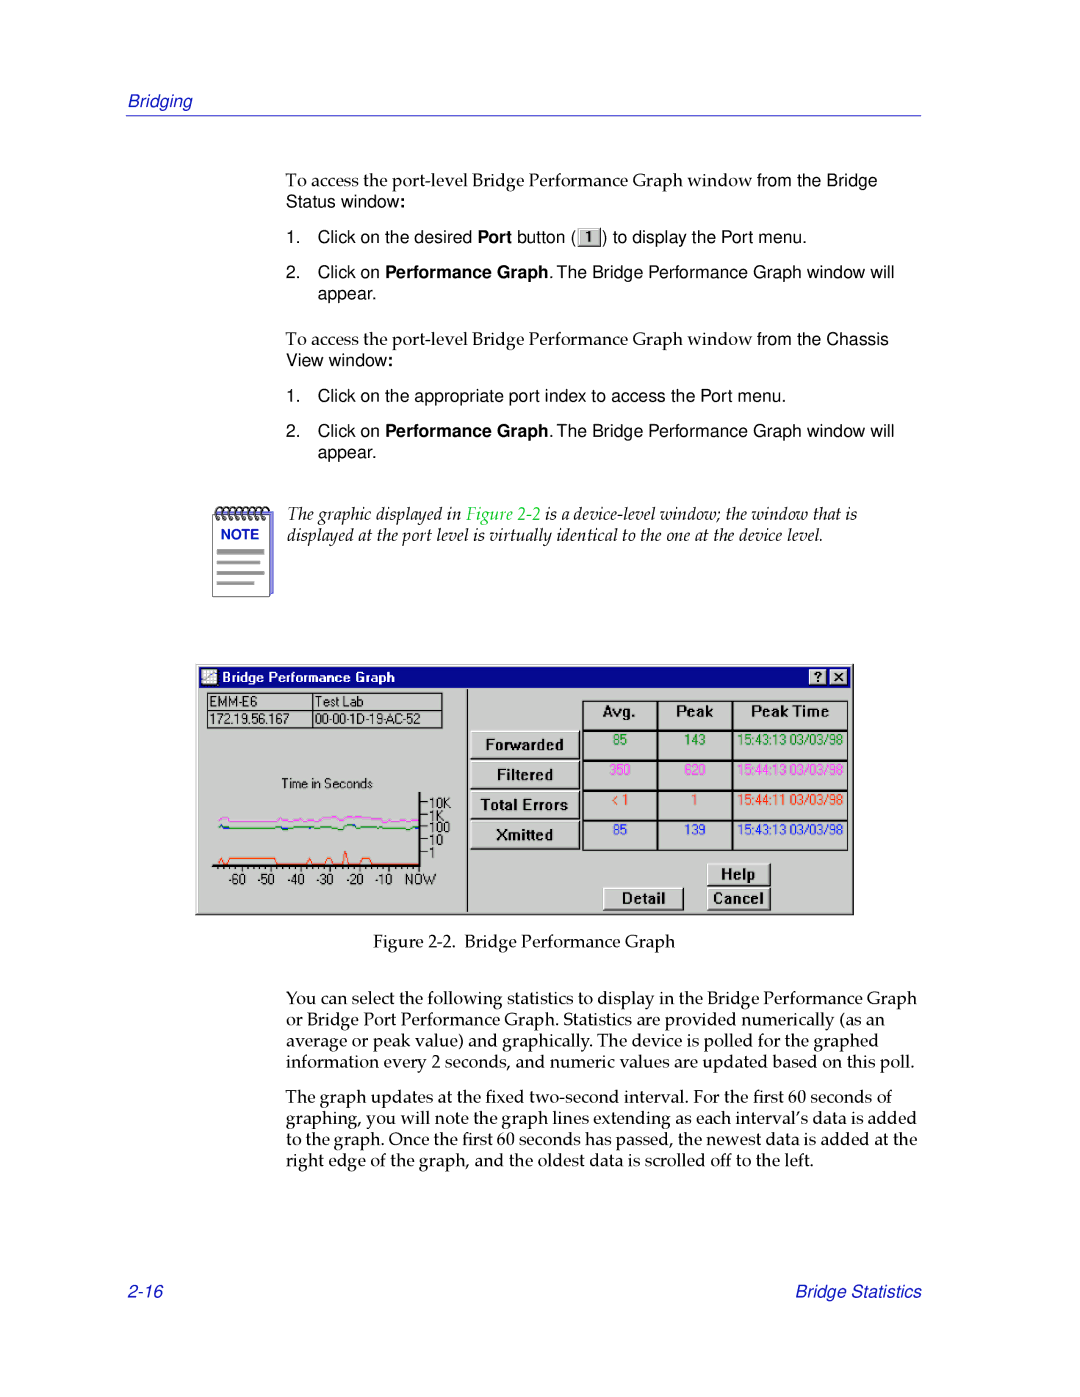
Figure 2-2. Bridge Performance Graph
You can select the following statistics to display in the Bridge Performance Graph or Bridge Port Performance Graph. Statistics are provided numerically (as an average or peak value) and graphically. The device is polled for the graphed information every 2 seconds, and numeric values are updated based on this poll.
The graph updates at the Þxed two-second interval. For the Þrst 60 seconds of graphing, you will note the graph lines extending as each intervalÕs data is added to the graph. Once the Þrst 60 seconds has passed, the newest data is added at the right edge of the graph, and the oldest data is scrolled off to the left.
Bridge Statistics |