Bridging
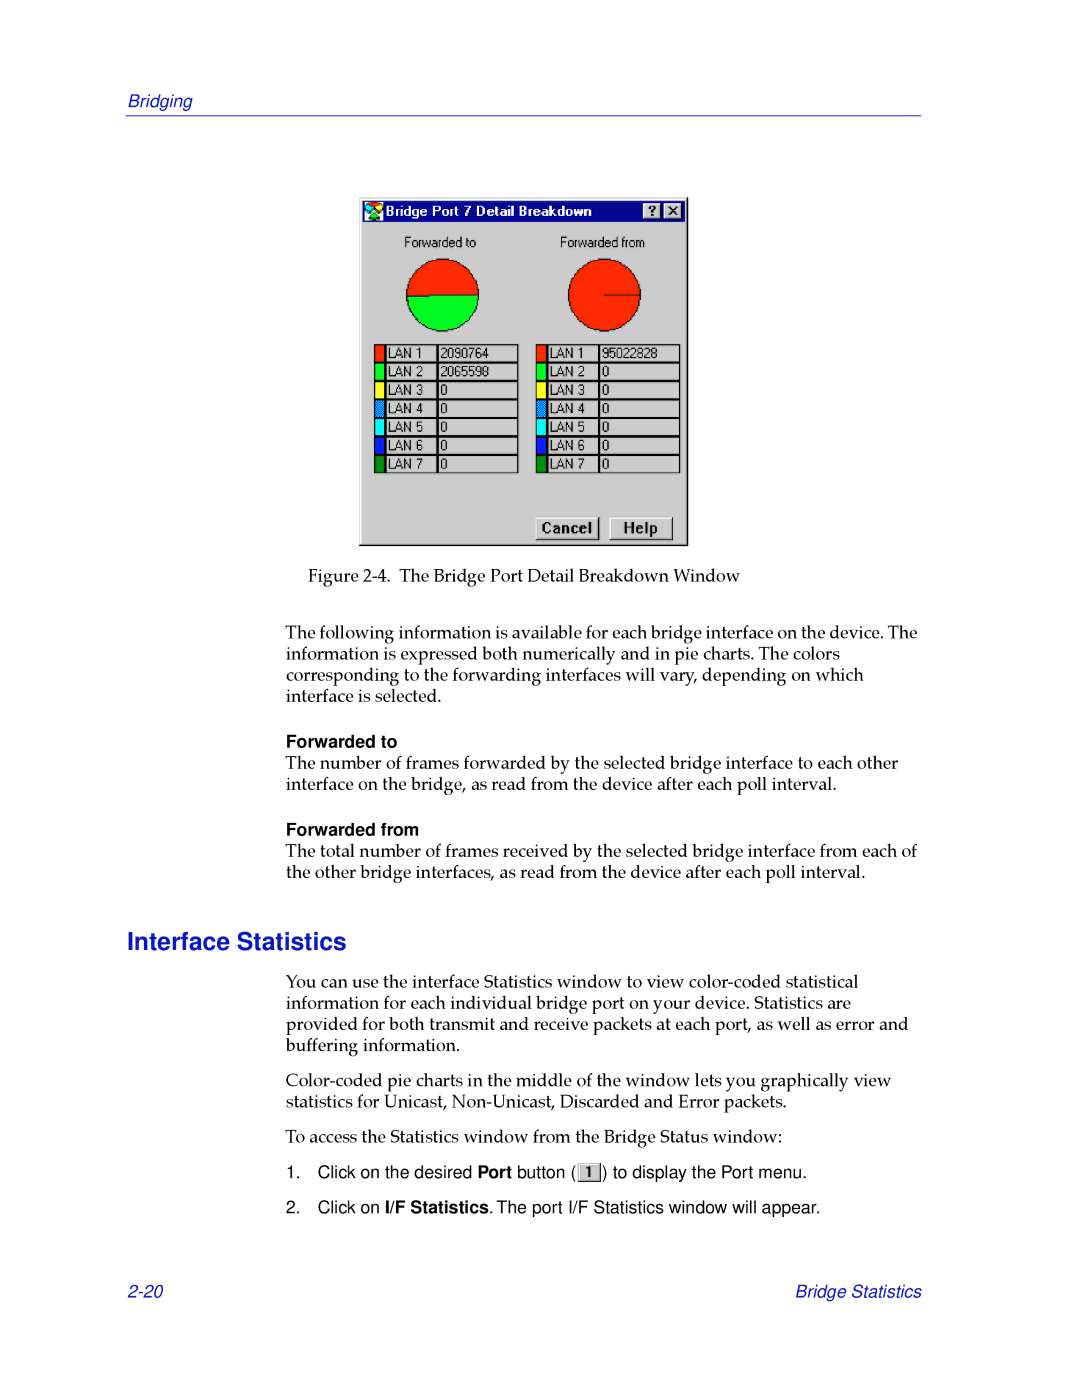
Figure 2-4. The Bridge Port Detail Breakdown Window
The following information is available for each bridge interface on the device. The information is expressed both numerically and in pie charts. The colors corresponding to the forwarding interfaces will vary, depending on which interface is selected.
Forwarded to
The number of frames forwarded by the selected bridge interface to each other interface on the bridge, as read from the device after each poll interval.
Forwarded from
The total number of frames received by the selected bridge interface from each of the other bridge interfaces, as read from the device after each poll interval.
Interface Statistics
You can use the interface Statistics window to view
To access the Statistics window from the Bridge Status window:
1.Click on the desired Port button (![]() ) to display the Port menu.
) to display the Port menu.
2.Click on I/F Statistics. The port I/F Statistics window will appear.
Bridge Statistics |