3Cable Testing with the FrameScope 350
Viewing Result Details
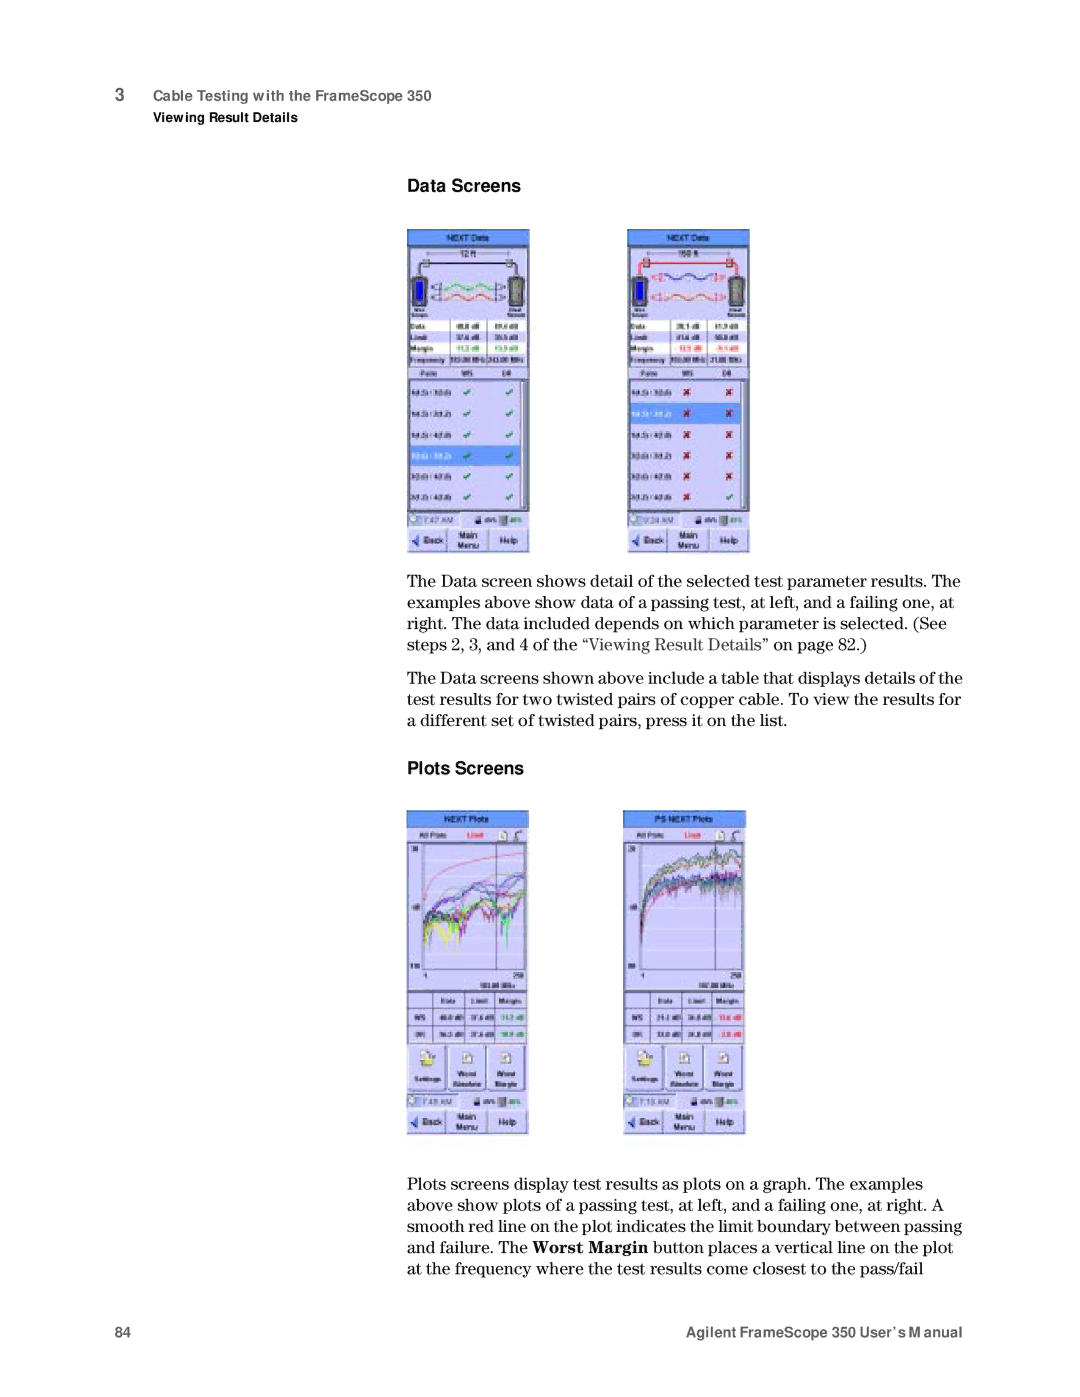
Data Screens
The Data screen shows detail of the selected test parameter results. The examples above show data of a passing test, at left, and a failing one, at right. The data included depends on which parameter is selected. (See steps 2, 3, and 4 of the “Viewing Result Details” on page 82.)
The Data screens shown above include a table that displays details of the test results for two twisted pairs of copper cable. To view the results for a different set of twisted pairs, press it on the list.
Plots Screens
Plots screens display test results as plots on a graph. The examples above show plots of a passing test, at left, and a failing one, at right. A smooth red line on the plot indicates the limit boundary between passing and failure. The Worst Margin button places a vertical line on the plot at the frequency where the test results come closest to the pass/fail
84 | Agilent FrameScope 350 User’s Manual |